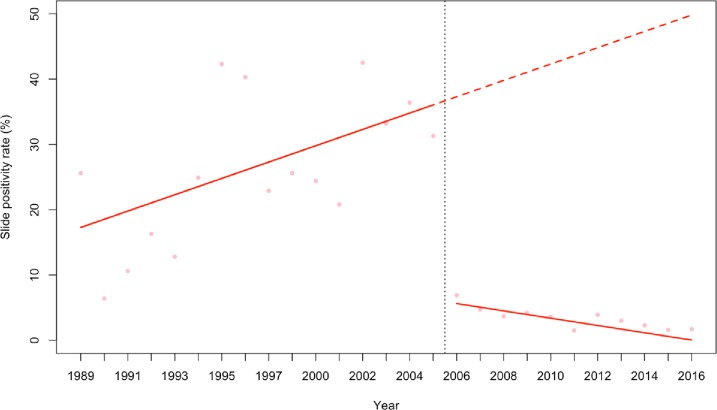
Fig 3. ITS model showing the trends in slide positivity rate during the pre-intervention and post-intervention periods.
Fitted lines illustrate the linear trends from model predictions of malaria SPR controlling for rainfall and controlling for autoregressive and moving average effects (solid red line) and observed malaria SPR (pink dots). The hypothetical trend in the absence of intervention is also shown (dashed red line).

