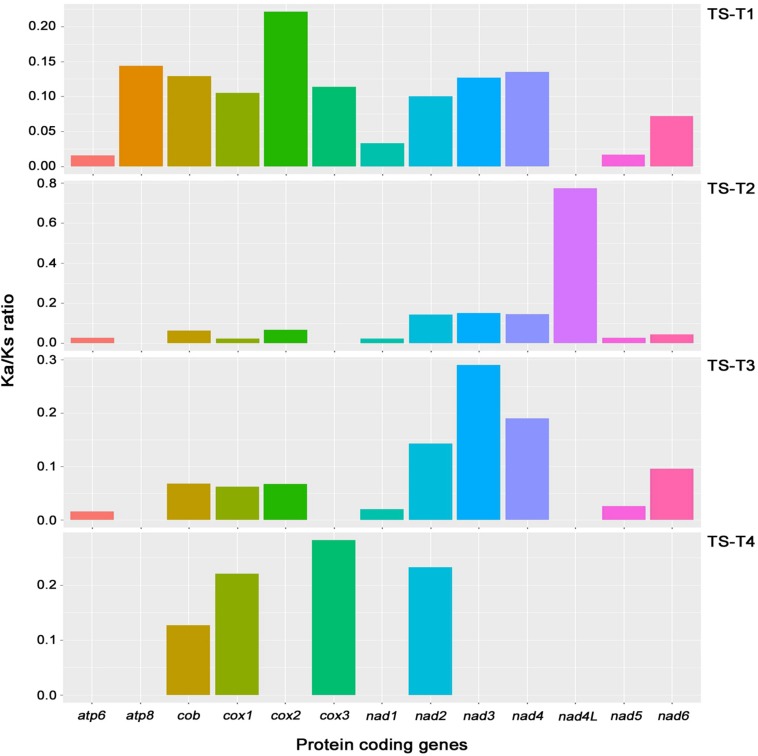
FIGURE 4.
Analysis of Ka/Ks ratios for 13 core genes of the T. atroviride ATCC 26799 mitochondrial genome. Obtained values for Ka/Ks ratios were described in Supplementary Table S6. Ka, nonsynonymous substitution rate; Ks, synonymous substitution rate; TS-T1, pairwise alignment between T. atroviride ATCC 26799 (TS) and T. reesei QM9414 (T1); TS-T2, pairwise alignment between T. atroviride ATCC 26799 (TS) and T. asperellum B05 (T2); TS-T3, pairwise alignment between T. atroviride ATCC 26799 (TS) and T. hamatum (T3); TS-T4, pairwise alignment between T. atroviride ATCC 26799 (TS) and T. gamsii KUC1747 (T4).

