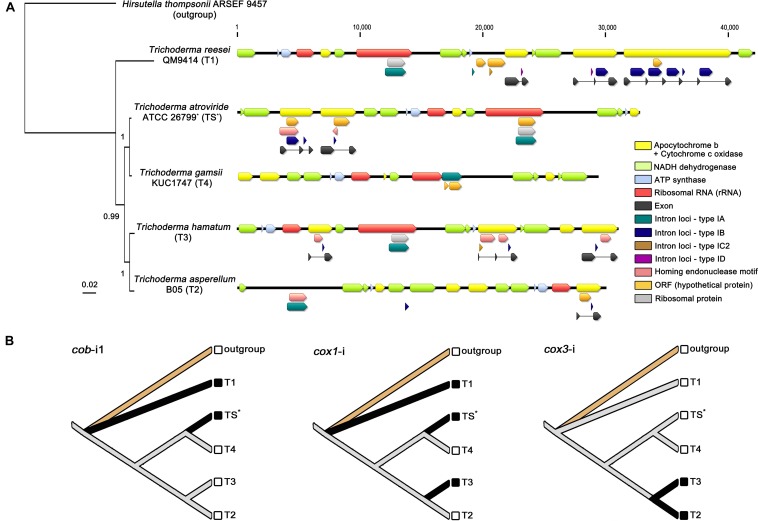
FIGURE 5.
Comparative analysis of Trichoderma mitochondrial introns. (A) All detected intron loci (described in Table 3) were displayed on the mitochondrial genomes with a BI based topology constructed using concatenated exon nucleotide sequences of 13 core genes (atp6, atp8, cob, cox1, cox2, cox3, nad1, nad2, nad3, nad4, nad4L, nad5, and nad6). All gene components were indicated with different color blocks. (B) Inference of gain/loss events of Trichoderma mitochondrial introns. Reconstructed ancestral states for introns were presented with species names designated as, outgroup for Hirsutella thompsonii ARSEF 9457 (Ophiocordycipitaceae), TS for T. atroviride ATCC 26799 (with an asterisk), T1 for T. reesei QM9414, T2 for T. asperellum B05, T3 for T. hamatum, and T4 for T. gamsii KUC1747. Solid black lines indicate the presence of a given intron character in corresponding species.

