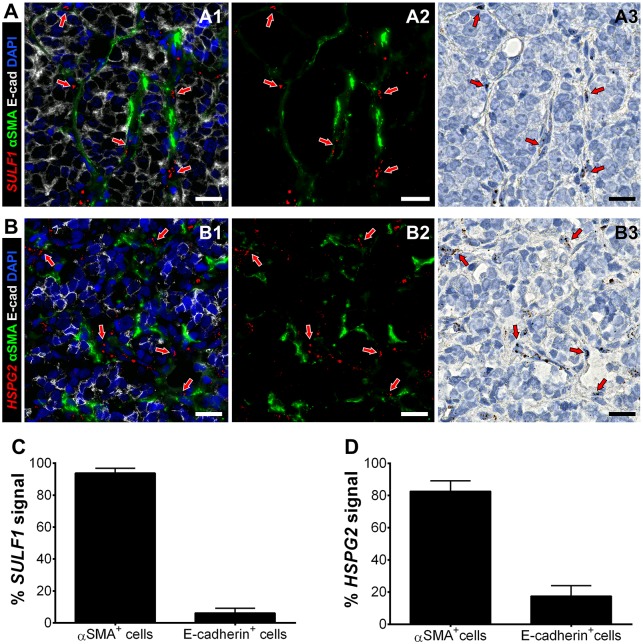
Fig 2. Multiplexing of RISH-immunofluorescence for detection of SULF1 or HSPG2, in tandem with stromal and epithelial markers.
SULF1 (A1-3) and HSPG2 (B1-3) expression was mainly detected in αSMA+ CAFs (green) surrounding E-cad+ tumor clusters (gray). A3 and B3 show the real chromogenic mRNA signals, which were deconvoluted for quantification, and merged with the green channel for easier visualization (A2 and B2), as described in Materials and Methods. The percentage of SULF1+ (C) and HSPG2+ (D) was measured in the stromal (αSMA+) and tumor (E-cad+) cell populations using Imaris, as described in Materials and Methods. A and B represent approximately 2.5X magnified regions of images acquired using a 40X objective, which are available as a whole in S2 Fig. Nuclei were counter-stained with DAPI (blue) and hematoxylin. Red arrows help indicate regions were the mRNA signal was detected. Scale bars represent 20 microns.

