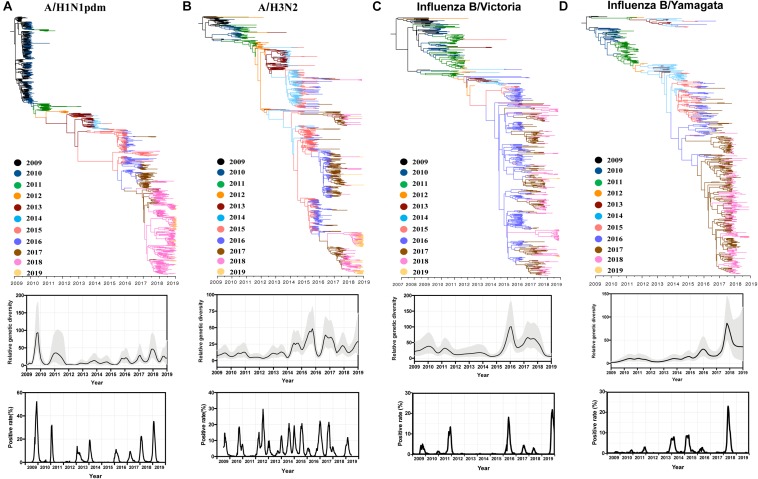
FIGURE 6.
Comparative phylogenetic analysis, population dynamics and positive rate of A/H1N1pdm (A), A/H3N2 (B), influenza B/Victoria (C), and influenza B/Yamagata (D) viruses. Phylogenies were inferred using the strict clock model and relative genetic diversity estimated using the Gaussian Markov Random Field (GMRF) model. The branches were colored by sampling year. Solid black lines in the GMRF plot represent mean relative genetic diversity, and the gray shades indicate the 95% HPD (highest probability density) intervals. The positive rate of A/H1N1pdm virus (2009–2019), A/H3N2 (2009–2019), influenza B/Victoria (2015–2019), influenza B/Yamagata (2015–2019) by week of specimen collection in China was retrieved from Chinese National Influenza Center.

