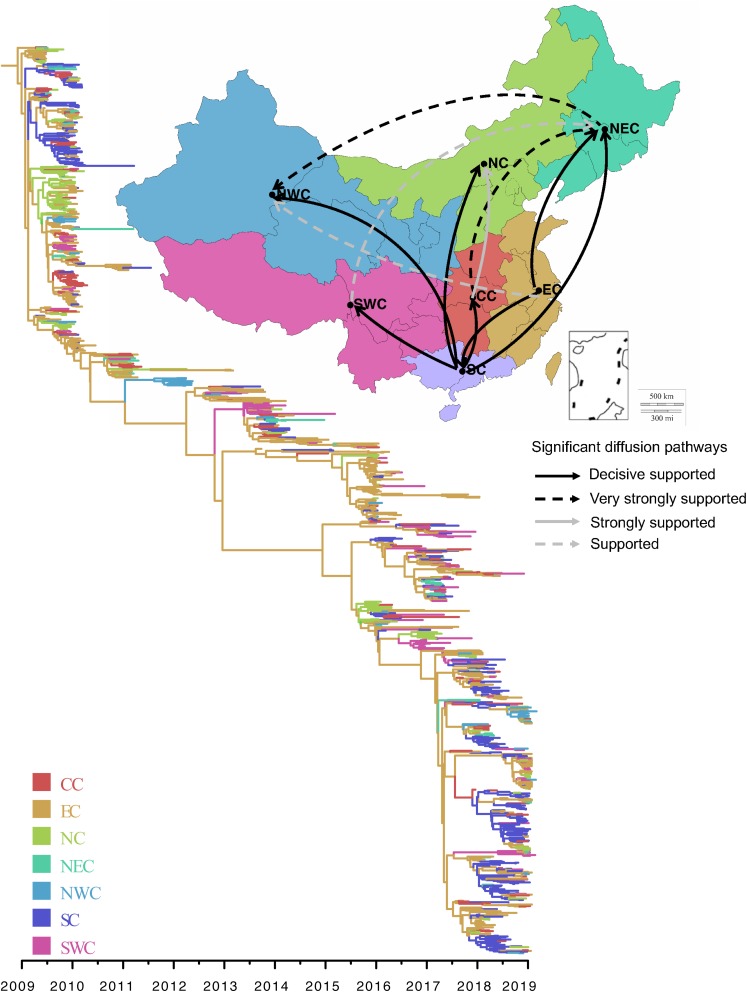
FIGURE 7.
Spatial diffusion of A/H1N1pdm virus. Thickness of lines represents supported migration rates: solid black arrows, decisive support with BF > 1000; dashed black arrows, very strongly supported with 100 < BF < 1000; solid gray arrows, strongly support with 10 < BF < 100; dashed gray arrows, support with 3 < BF < 10. In the phylogenetic tree, colored branches represent different regions. North China (NC), Northeast China (NEC), Northwest China (NWC), Central China (CC), East China (EC), South China (SC), and Southwest China (SWC).

