. 2020 Apr 9;128(4):047005. doi: 10.1289/EHP5843

Figure 6.

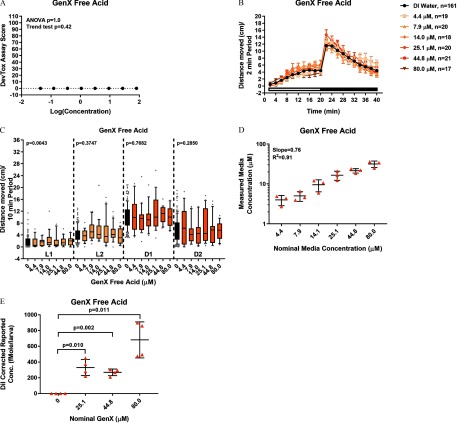
Figure 6A is a graph titled GenX Free Acid, plotting DevTox Assay Score, ranging from negative 10 to 110 (y-axis) where ANOVA p-value equals 1.0, trend test p-value equals 0.42 across log concentration, ranging from negative 2 to 2 (x-axis). Figure 6B is a graph titled GenX Free Acid, plotting distance moved in centimeters per 2 minute period, ranging from negative 2 to 20 (y-axis) for DI water, n equals 161; 4.4 micromolar, n equals 19; 7.9 micromolar, n equals 20; 14.0 micromolar, n equals 18; 25.1 micromolar, n equals 20; 44.8 micromolar, n equals 21; and 80.0 micromolar, n equals 17 across time, ranging from 0 to 40 minutes in increments of 4 (x-axis). Figure 6C is a graph titled GenX Free Acid, plotting distance moved in centimeters per 10 minute period, ranging from negative 4 to 36 in increments of 4 (y-axis) for p-value equals 0.0043 (L1), p-value equals 0.3747 (L2), p-value equals 0.7682 (D1), and p-value equals 0.2850 (D2) across GenX Free Acid, ranging from 0.0 to 80.0 micromolar (x-axis). Figure 6D is a graph titled GenX Free Acid, plotting measured media concentration, ranging from 1 to 100 micromolar (y-axis) for slope equals 0.76 and R squared equals 0.91 across nominal media concentration, ranging from 4.4 to 80.0 micromolar (x-axis). Figure 6E is a graph titled GenX Free Acid, plotting dilution corrected reported concentration, ranging from 0 to 100 femtomoles per larva (y-axis), for DMSO vs. 25.1 micromolar GenX Free Acid, p-value equals 0.010; DMSO vs. 44.8 micromolar GenX Free Acid, p-value equals 0.002; and DMSO vs. 80.0 micromolar GenX Free Acid, p-value equals 0.011 across nominal GenX, ranging from 0.0 to 80.0 micromolar (x-axis).

Developmental and behavioral assays and media and tissue concentrations in zebrafish exposed to GenX Free Acid diluted in DI water. (A) Developmental toxicity scores at 6 dpf obtained from zebrafish developmentally exposed to 0.0480.0μM GenX Free Acid diluted in DI water daily, from 05 dpf. Significance was determined by one-way ANOVA with a Tukey’s multiple comparison test (p<0.05). n=6 larvae per concentration tested. For the DNT assay, zebrafish were exposed to 4.480.0μM GenX Free Acid daily, from 05 dpf. At 6 dpf, locomotor activity was assessed. (B) Distance moved (cm) each 2-min period or (C) mean distance moved during the light 1 (L1), light 2 (L2), dark 1 (D1), or dark 2 (D2) 10-min periods are shown. Repeated measures ANOVA models were run separately by period (L1, L2, D1, or D2). If a significant effect of concentration was detected (p<0.0125), within-period pairwise comparisons to control were computed using t-tests with a Dunnett adjustment for multiple comparisons (*p<0.05). n=1721 zebrafish per concentration and 161 DI water control larvae were assessed. (D) Media concentrations and (E) internal tissue dose at 6 dpf following daily exposure to 25.180.0μM GenX Free Acid. n=3 media replicates and n=4 biological replicates each comprising 10 pooled larvae. Significance was determined by a Welch’s ANOVA followed by a Dunnett T3 test (p<0.05). Additional one-sample Student’s t-tests were performed (p<0.05). Note: ANOVA, analysis of variance; D, dark phase; DevTox, developmental toxicity; DI, deionized; Dil, dilution; DNT, developmental neurotoxicity; dpf, days post fertilization; GenX Free Acid, perfluoro-2-propoxypropanoic acid; L, Light period.