. 2020 Apr 30;128(4):047011. doi: 10.1289/EHP6262

Figure 1.

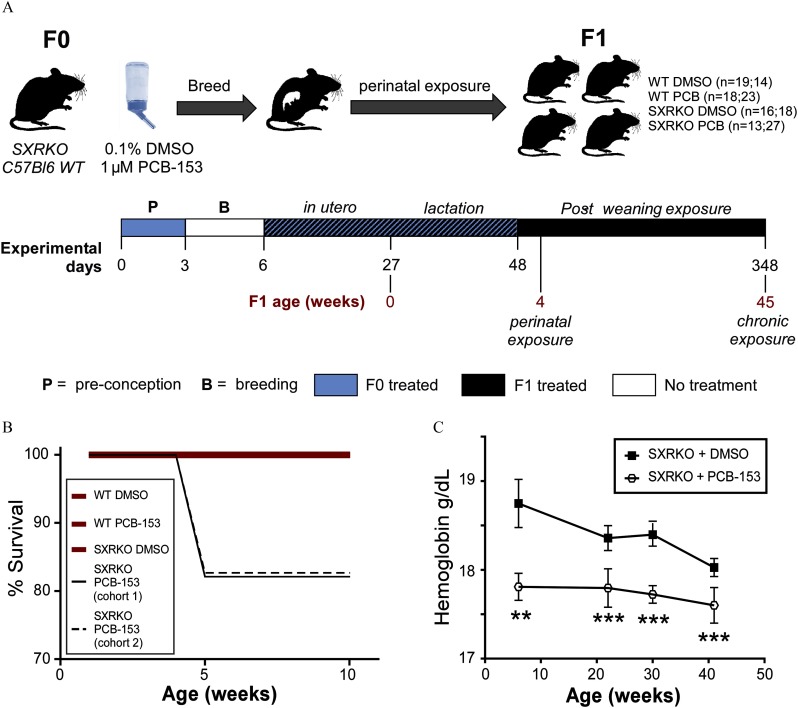
Figure 1A is a visual for the experimental setup for the PCB-153 exposure experiments, wherein F0 female SXRKO and C57BL6 WT mice are exposed to either 0.1 percent DMSO or 1 microMolar PCB-153 in the drinking water then bred. This generates F1 mice for perinatal and chronic exposure experiments with WT exposed to DMSO (n equals 19; 14), WT exposed to PCB (n equals 18; 23), SXRKO exposed to DMSO (n equals 16; 18), and SXRKO exposed to PCB (n equals 13; 27) with the first number referring to the perinatal experiment and second number referring to chronic exposure experiment. For the scale of experimental days, 0 to 3 is P (pre-conception), 3 to 6 is B (breeding with no exposure), 6 to 27 is in utero, 27 to 48 is lactation, and 48 to 348 is post weaning exposure with endpoints for F1 at age 4 weeks for perinatal exposure and F1 age of 45 weeks for chronic exposure. Figure 1B is a graph plotting percent survival, ranging from 70 to 100 with increments of 10 (y-axis) across age (weeks), ranging from 0 to 10 with increments of 5 (x-axis) for WT DMSO, WT PCB-153, SXRKO DMSO, SXRKO PCB-153 (cohort 1), and SXRKO PCB-153 (cohort 2). Figure 1C is a graph, plotting hemoglobin gram per deciliter, ranging from 17 to 19 (y-axis) across age (weeks), ranging from 0 to 50 with increments of 10 (x-axis) for SXRKO plus DMSO and SXRKO plus PCB-153.

Experimental setup, survival, and blood hemoglobin analysis of wild-type (WT) and steroid and xenobiotic receptor knockout (SXRKO) mice exposed to polychlorinated biphenyl 153 (PCB-153) or vehicle. (A) Exposure schematic for perinatal and chronic exposure to PCB-153; number of mice per group are reported as (n=number of mice for perinatal study; number of mice for chronic study). (B) Survival of WT or SXRKO mice exposed to PCB-153 or vehicle [dimethylsulfoxide (DMSO)] in chronic exposure study; both cohorts of SXRKO mice exposed to PCB-153 are shown independently (cohort 1, n=16; cohort 2, n=11); all other groups are shown as the sum of both cohorts (WT DMSO, n=14; WT PCB, n=23; SXRKO DMSO, n=18) and merged together in one bold red line. (C) Hemoglobin measurements of SXRKO mice exposed to DMSO (n=18) or PCB-153 (n=22) throughout lifespan in chronic exposure study, plotted as mean±standarderrorofthemean(SEM). **p<0.01; ***p<0.001 determined by Student’s t-test.