. 2020 Apr 30;128(4):047011. doi: 10.1289/EHP6262

Figure 2.

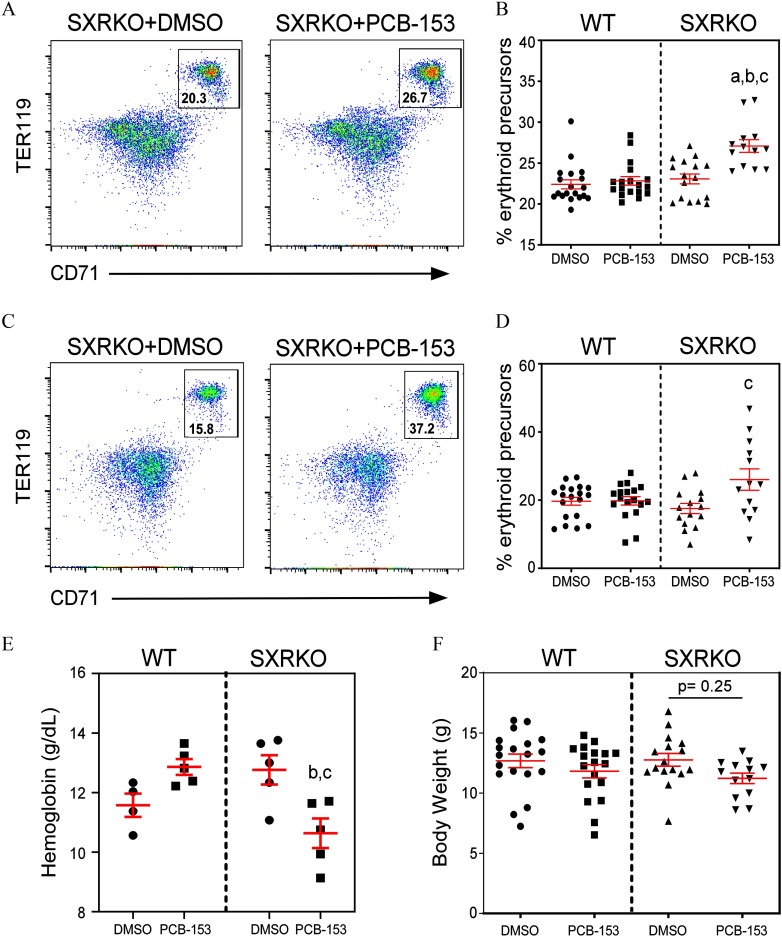
Figures 2A is a set of two flow cytometry dot plots plotting TER119 (y-axis) across CD71 (x-axis) of the bone marrow from SXRKO plus DMSO on the left and SXRKO plus PCB-153 on the right. Figures 2B is a graph plotting percentage of erythroid precursors in the bone marrow, ranging from 15 to 40 with increments of 5 (y-axis) for WT plus DMSO, WT plus PCB-153, SXRKO plus DMSO, and SXRKO plus PCB-153 (x-axis). Figure 2C is a set of two flow cytometry dot plots plotting TER119 (y-axis) across CD71 (x-axis) for the spleen of SXRKO plus DMSO on the left and SXRKO plus PCB-153 on the right. Figures 2D is a graph plotting percentage of erythroid precursors in the , ranging spleen from 0 to 60 with increments of 20 (y-axis) for WT plus DMSO, WT plus PCB-153, SXRKO plus DMSO, and SXRKO plus PCB-153 (x-axis). Figure 2E is a graph plotting hemoglobin, ranging from 8 to 16 grams per deciliter with increments of 2 (y-axis) for WT plus DMSO, WT plus PCB-153, SXRKO plus DMSO, and SXRKO plus PCB-153 (x-axis). Figure 2F is a graph plotting body weight, ranging from 0 to 20 grams with increments of 5 (y-axis) for WT plus DMSO, WT plus PCB-153, SXRKO plus DMSO, and SXRKO plus PCB-153 (x-axis).

Erythroid precursors, blood hemoglobin, and body weights of 4-wk-old wild-type (WT) and steroid and xenobiotic receptor knockout (SXRKO) mice perinatally exposed to polychlorinated biphenyl 153 (PCB-153) or vehicle. Representative fluorescence-activated cell sorter (FACS) plots of (A) bone marrow or (C) spleens of SXRKO mice exposed to dimethylsulfoxide (DMSO) and PCB-153, gating on erythroid precursors. Quantifications of erythroid precursors in (B) bone marrow and (D) spleens of 4-wk-old perinatally exposed mice (WT DMSO, n=19; WT PCB, n=18; SXRKO DMSO, n=16; SXRKO PCB, n=13) plotted as mean±standarderrorofthemean(SEM). (E) Blood hemoglobin levels of WT and SXRKO mice at 4 wk of age perinatally exposed to either DMSO or PCB-153 (n=5pergroup) plotted as mean±SEM. (F) Body weights of exposed mice at 4 wk of age (WT DMSO, n=19; WT PCB, n=18; SXRKO DMSO, n=16; SXRKO PCB, n=13) plotted as mean±SEM. a, statistically significant compared to WT DMSO; b, statistically significant compared to WT PCB; c, statistically significant compared to SXRKO DMSO determined by two-way analysis of variance (ANOVA) and Tukey’s multiple-comparisons test.