. 2020 Apr 30;128(4):047011. doi: 10.1289/EHP6262

Figure 6.

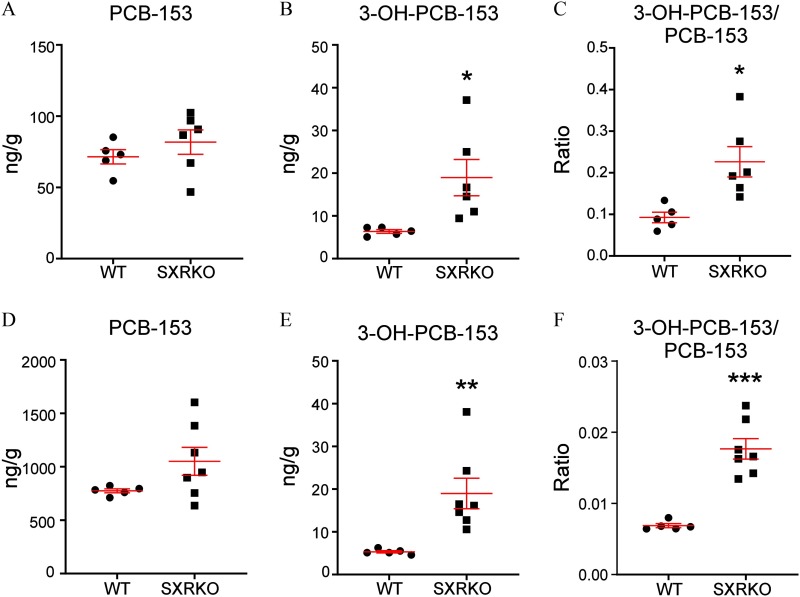
Figures 6A, 6B, and 6C are graphs for plasma samples titled PCB-153, 3-OH-PCB-153, and 3-OH-PCB-153 divided by PCB-153, plotting nanograms per gram, ranging from 0 to 150 with increments of 50; nanograms per gram, ranging from 0 to 50 with increments of 10; ratio, ranging from 0.0 to 0.5 with increments of 0.1 (y-axis), respectively, for WT and SXRKO (x-axis). Figure 6D, 6E, and 6F are graphs for liver samples titled PCB-153, 3-OH-PCB-153, and 3-OH-PCB-153 divided by PCB-153 plotting nanograms per gram, ranging from 0 to 2000 with increments of 500; nanograms per gram, ranging from 0 to 50 with increments of 10; and ratio, ranging from 0.00 to 0.03 (y-axis), respectively, for WT and SXRKO (x-axis).

Levels of polychlorinated biphenyl 153 (PCB-153) and the PCB-153 metabolite, 3-OH-PCB-153, in exposed wild-type (WT) and steroid and xenobiotic receptor knockout (SXRKO) mice at 4 wk of age. Levels of (A) PCB-153 and (B) 3-OH-PCB-153 and (C) the ratio of 3-OH-PCB-153 to PCB-153 in the plasma of PCB-153-exposed WT (n=5) and SXRKO (n=6) mice plotted as mean±standarderrorofthemean(SEM). Levels of (D) PCB-153 and (E) 3-OH-PCB-153 and (F) the ratio of 3-OH-PCB-153 to PCB-153 in liver of PCB-153-exposed WT (n=5) and SXRKO (n=7) mice plotted as mean±SEM. *p<0.05; **p<0.01; ***p<0.001 determined by Student’s t-test.