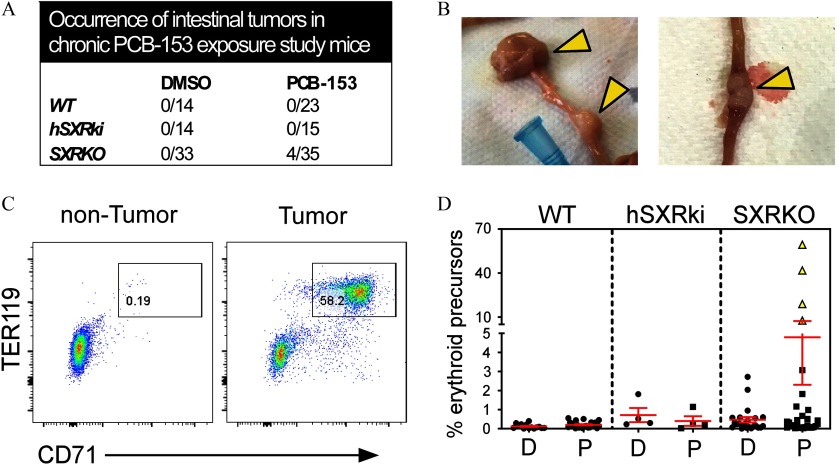
Figure 7.
Prevalence and characterization of intestinal tumors in steroid and xenobiotic receptor knockout (SXRKO) mice chronically exposed to polychlorinated biphenyl 153 (PCB-153) until 10 months of age. (A) Number of intestinal tumors found in the upper intestine of 10-month-old wild-type (WT), SXRKO, and human SXR/pregnane X receptor (PXR) knock-in (hSXRki) mice chronically exposed to PCB-153 or dimethylsulfoxide (DMSO). (B) Representative images of the tumors (indicated by yellow arrowheads) located near the duodenum–jejunum junction of the upper intestine. (C) Representative fluorescence-activated cell sorter (FACS) plots of the spleen of a nontumor- vs. tumor-bearing mouse, gating on erythroid precursors. (D) Quantification of erythroid precursor percentage in the spleens of chronically exposed mice (WT DMSO, ; WT PCB, ; hSXRki DMSO, ; hSXRki PCB, ; SXRKO DMSO, ; SXRKO PCB, ) plotted as ; tumor-bearing mice are indicated with yellow triangle symbols.

