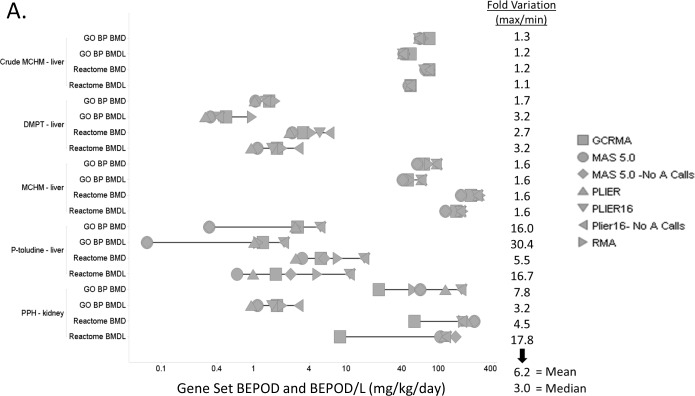
Fig 4. Effect of normalization on the lowest median BMD (BEPOD) and BMDL (BEPOD/L) values for GO:BP and Reactome pathways.
The distribution of BEPOD and BEPOD/L values across 7 normalizations are shown for each of the 5 experiments. Fold variation: max BEPOD to min BEPOD (or max BEPOD/L to min BEPOD/L) ratio. Mean and median fold variations are shown for BEPOD/L vales.

