
Fig 2.
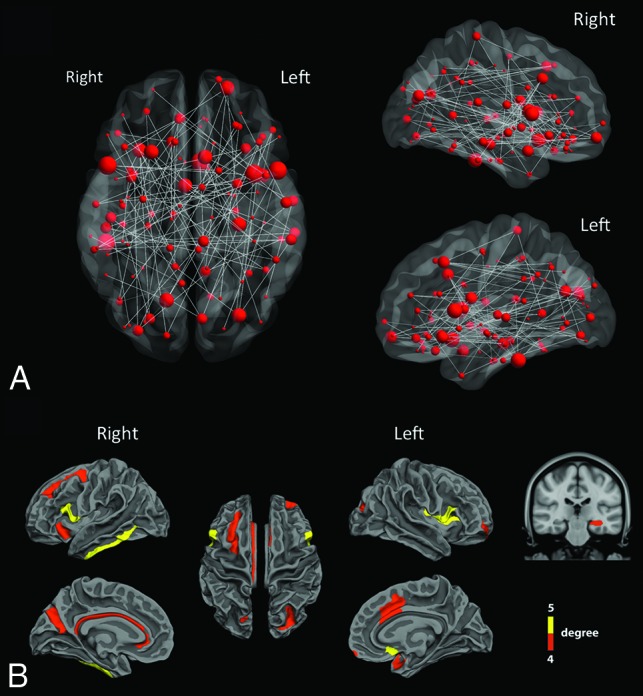
Altered structural connections in patients with TGA. A, Structural connectivity differences between controls and patients with TGA at acute phase. The gray lines mean significant decrease of connectivity in patients compared with controls. The red dots represent the location of ROIs and their size is proportional to the number of significant connections. A network of 113 ROIs and 114 connections had significantly decreased structural connectivity in patients with TGA (P < .05 NBS corrected, t-values ranging from 3.03–8.73). B, In this widespread network, the cortical and subcortical regions (nodes) with a number of significantly altered connections between patients and controls greater than 4 were mainly located in inferior and mesial temporal, cingulate, and frontal cortices.