
Figure 4.
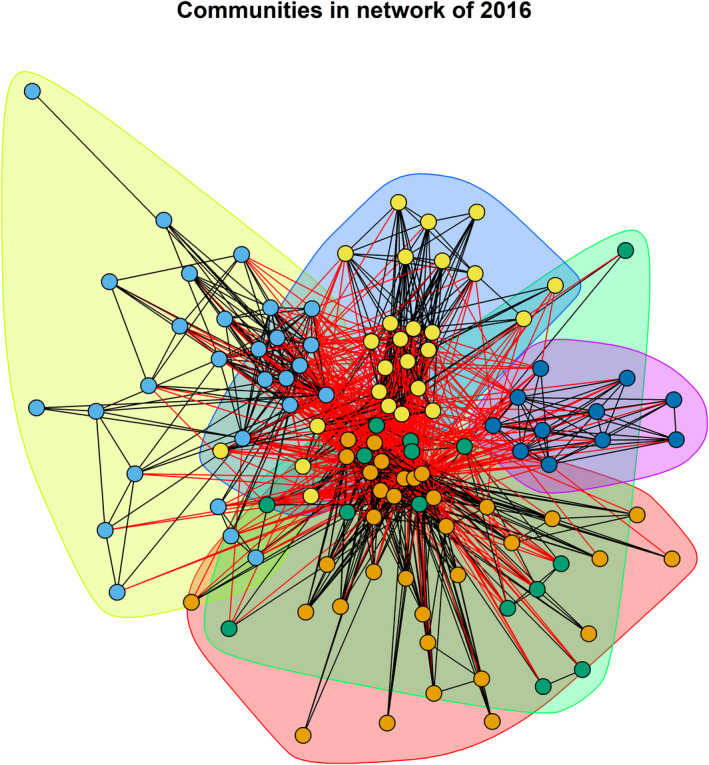
Graph of the combined static network of pig movement through wholesale live pig markets in Guangdong in January and June 2016. Different coloured areas represent five different communities in the network, and nodes with the same colour belong to the same community [Colour figure can be viewed at wileyonlinelibrary.com]