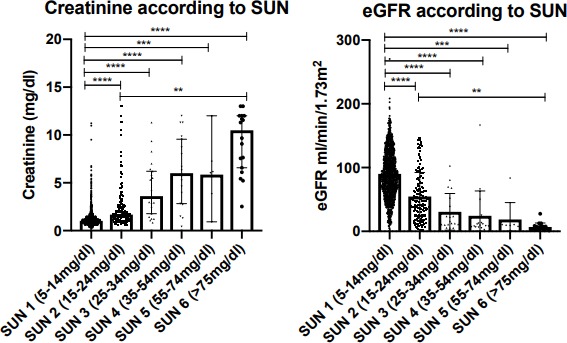
Figure 2.

Creatinine and EGFR according to sun result. All SUN tests undertaken at all time points are included. Plots demonstrate median and 95% CIs around the median; statistical significance demonstrated is according to Dunn’s multiple comparison testing (**p<0.01, ***p<0.001, ****p<0.0001). EGFR, estimated glomerular filtration rate; SUN, Saliva Urea Nitrogen.
