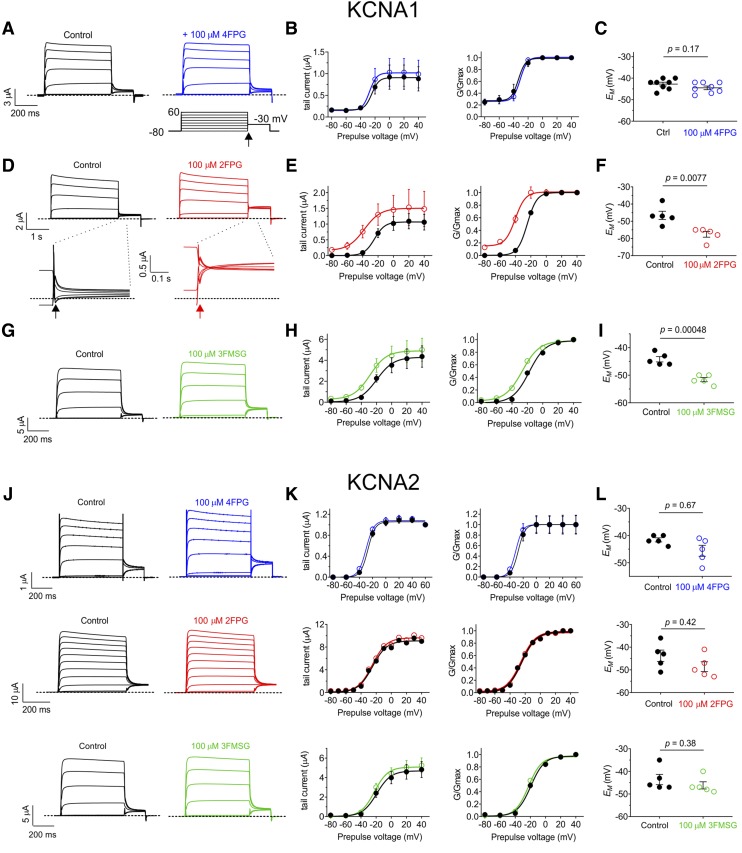
Fig. 2.
2FPG activates KCNA1 but not KCNA2. All error bars indicate S.E.M. Dashed lines indicate zero current level here and in all other figures. (A) Mean traces showing effects of 4FPG on KCNA1; n = 8. Lower right inset: voltage protocol used for all Kv channel recordings in this study. Arrow shows time point at which tail currents are quantified. (B) Mean and normalized (G/Gmax) KCNA1 tail current vs. prepulse voltage relationships calculated from traces as in (A); n = 8. (C) Effects of 4FPG (100 µM) on resting membrane potential (EM) of unclamped X. laevis oocytes expressing KCNA1; n = 8. (D) Mean traces showing effects of 2FPG (100 µM) on KCNA1; n = 5. Lower insets: expanded view of tail currents; arrows show time point at which tail currents are quantified. (E) Mean and normalized (G/Gmax) KCNA1 tail currents vs. prepulse voltage relationships calculated from traces as in (D); n = 5. (F) Effects of 2FPG (100 µM) on resting membrane potential (EM) of unclamped X. laevis oocytes expressing KCNA1; n = 5. (G) Mean traces showing effects of 3FMSG (100 µM) on KCNA1; n = 5. (H) Mean and normalized (G/Gmax) KCNA1 tail current vs. prepulse voltage relationships calculated from traces as in (G); n = 5. (I) Effects of 3FMSG (100 µM) on resting membrane potential (EM) of unclamped X. laevis oocytes expressing KCNA1; n = 5. (J) Mean traces showing effects of 4FPG, 2FPG, and 3FMSG (100 µM) on KCNA2; n = 5. (K) Mean and normalized (G/Gmax) KCNA2 tail current vs. prepulse voltage relationships calculated from traces as in (A); n = 5. (L) Effects of 4FPG, 2FPG, and 3FMSG (100 µM) on resting membrane potential (EM) of unclamped X. laevis oocytes expressing KCNA2; n = 5.

