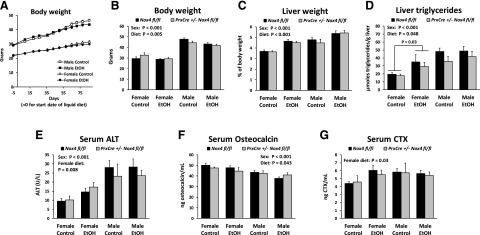
Fig. 4.
Chronic ethanol feeding for 3 months affects body composition and bone turnover. (A) The diagram illustrates the time course of the body weights for males and females fed either the ethanol diet or control diet for 3 months. (B–D) Body weight, relative liver weight, and the concentration of liver triglycerides were determined at the end of the chronic ethanol feeding experiment. (E–G) Serum concentrations of ALT, Osteocalcin and CTX were determined. Three-way ANOVAs were conducted with sex, diet, and genotype as the three factors. The panels indicate significant main effects. For ALT and CTX, a separate two-way ANOVA for just the data for females was calculated. EtOH, ethanol.

