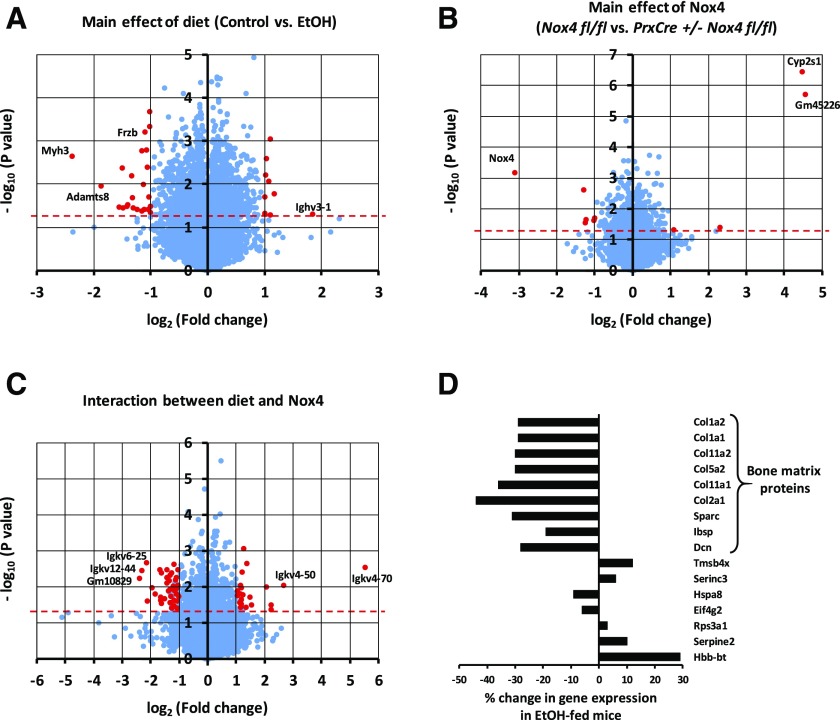
Fig. 7.
RNA-Seq analysis of femoral shafts of mice from the chronic ethanol feeding experiment. RNA-Seq was conducted on femoral shaft RNA isolated from male mice. A two-way ANOVA was conducted for each gene with diet and genotype as the two factors. The test probabilities were not adjusted for the multiplicity of genes. Volcano plots depicting the test probability for each gene against the fold change in gene expression are shown for the main effect of diet (A), the main effect of genotype (B), and the interaction effect between diet and genotype (C). Points above the red horizontal dashed line represent genes with test probabilities P < 0.05. Red points indicate genes with at least a 2-fold change in gene expression and a test probability P < 0.05. (D) Among the 100 genes with the highest expression levels in Nox4 fl/fl mice on the control diet, the change in gene expression caused by ethanol is depicted for the 16 genes that show a significant (P < 0.05) main diet effect. EtOH, ethanol.

