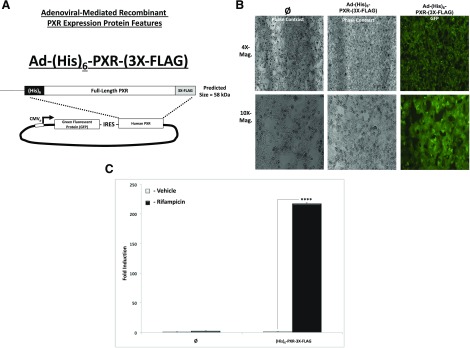
Fig. 1.
Adenoviral vector, cell morphology, GFP protein expression, and Ad-(His)6-PXR-(3X-FLAG) biologic function. Cells were observed and recorded 48 hours post-transduction with the novel adenoviral expression vector (A) using both bright-field and fluorescence microscopy (B) to visualize transduction efficiency and cell viability. (C). Hepa1-6 cells were transduced with blank virus (∅ − GFP) or Ad-(His)6-PXR-(3X-FLAG) for 48 hours (MOI = 10), and cells were treated with either vehicle (0.1% DMSO) or Rif (10 μM) for an additional 24 hours. rt-QPCR was performed, and Cyp3a11 gene expression levels were determined (n = 3). Data are expressed as fold induction ± S.D. compared with 18S ribosomal RNA expression. Asterisk (****) indicates statistically significant induction (P ≤ 0.001). Mag., magnification.

