
Figure 2.
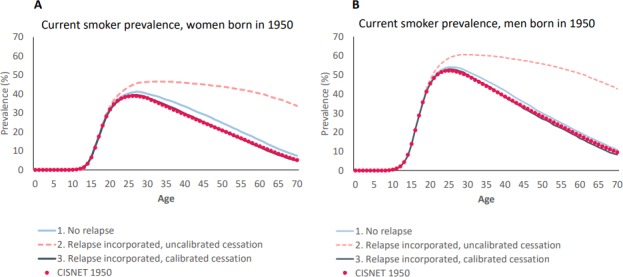
Cross-validation and calibration exercise: Simulation of Tobacco and Nicotine Outcomes and Policy (STOP)-generated results and Cancer Intervention and Surveillance Modeling Network (CISNET)-generated results for current smoking prevalence over time for US people born in 1950. (A) Women. (B) Men. The red-dotted line shows results from the CISNET model. The other three lines show STOP-generated results after each step of our parameterisation and calibration process. The blue line includes parameterisation of smoking initiation and cessation, but not relapse. The pink-dashed line includes smoking relapse as based on published studies. The black line includes calibration of smoking cessation probabilities to reflect quit attempts and relapse before sustained abstinence.