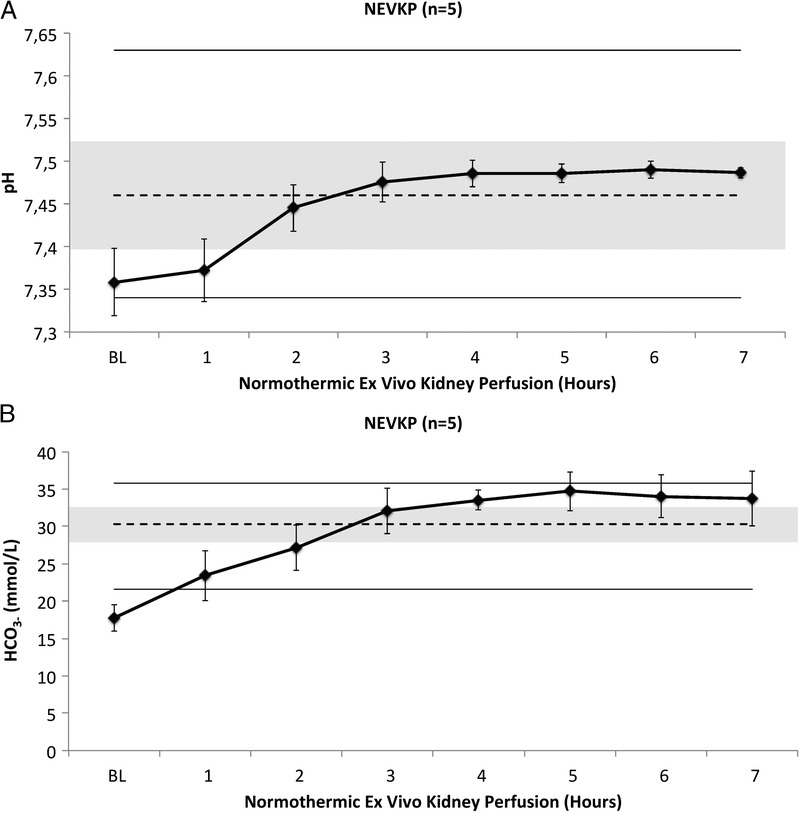
FIGURE 3.

A, pH of the perfusate during normothermic ex vivo kidney perfusion. Values presented as mean ± SD. Dashed line and grey area represent mean serum pH with SD measured in situ in 20 anesthetized pigs; upper and lower lines represent maximal and minimal pH values in these pigs. B, HCO3− concentration in the perfusate during Normothermic Ex Vivo Kidney Perfusion. Values presented as mean ± SD in mmol/L. Dashed line and grey area represent mean serum HCO3− with SD measured in situ in 20 anesthetized pigs; upper and lower lines represent maximal and minimal HCO3− values in these pigs.
