FIGURE 3.

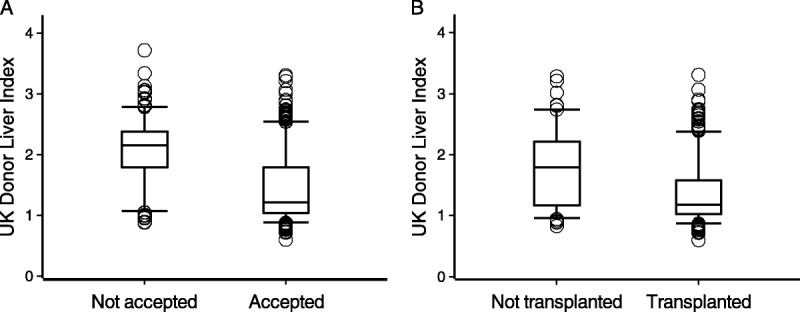
Box plots showing the distribution of the DLI indices for all donors (A) where the liver was offered and either accepted or not accepted for transplant and (B) whether the accepted livers were subsequently transplanted.

Box plots showing the distribution of the DLI indices for all donors (A) where the liver was offered and either accepted or not accepted for transplant and (B) whether the accepted livers were subsequently transplanted.