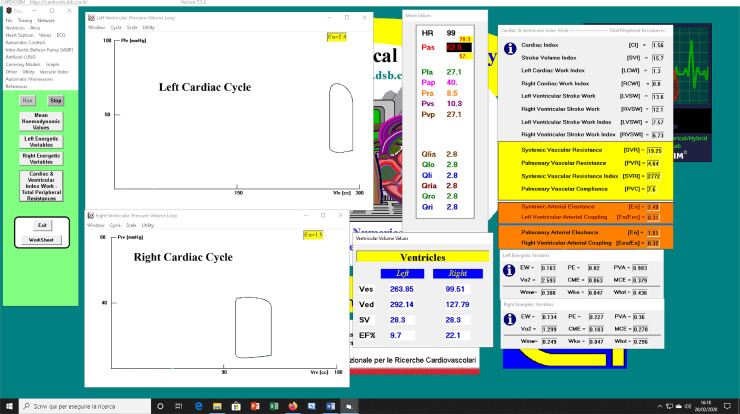
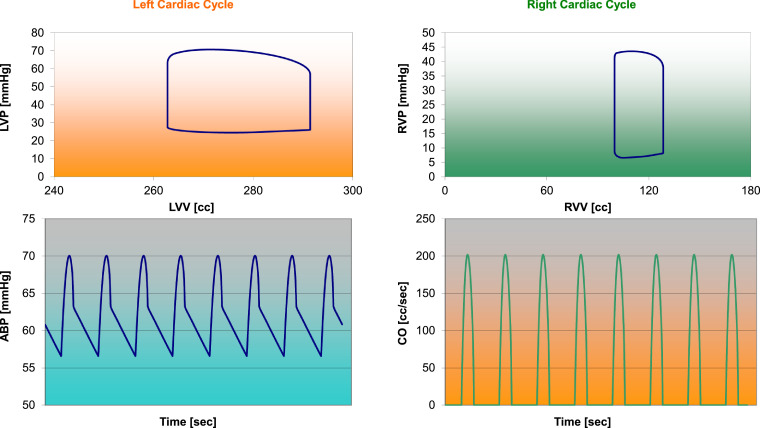
Fig. 4.
(a) Screen output from CARDIOSIM© software simulator with data obtained when patient's baseline conditions were reproduced. The simulation was performed using literature data reported in Table 1. (b) Data obtained during baseline patient's simulation, which have been stored in excel file and subsequently processed. The left (right) upper window shows the left (right) ventricular loop plotted in the pressure-volume plane. Left (right) lower window shows the aortic blood pressure (cardiac output) during multiple cardiac cycles.


