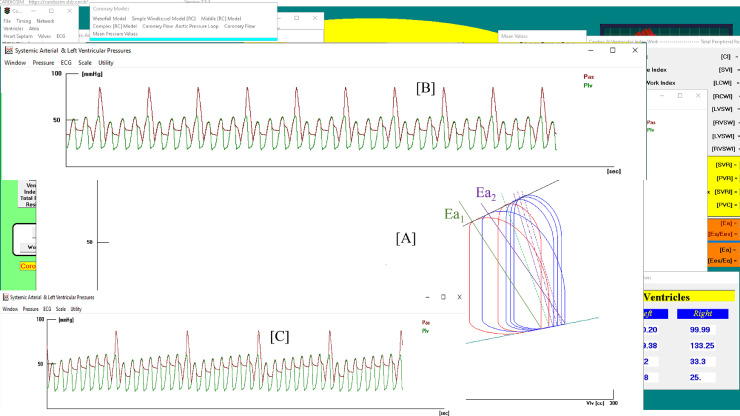
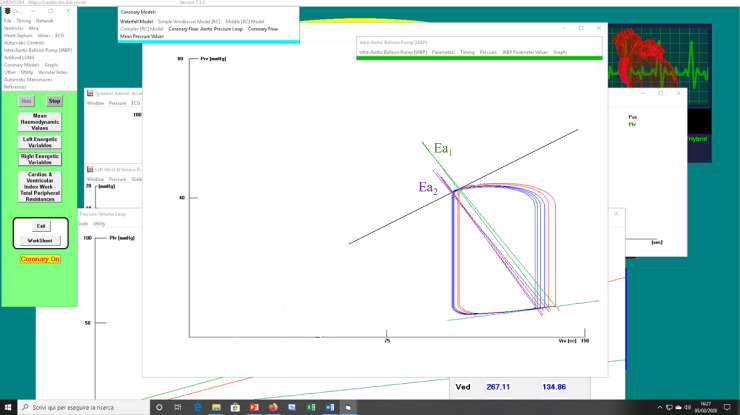
Fig. 5.
(a) Screen output from CARDIOSIM© software simulator with instantaneous values obtained during IABP assistance. Window [A] shows the left ventricular loops obtained when IABP ratio was set to 1:2 (red lines) and to 1:4 (blue lines). Ea1, green lines (Ea2, lilac lines) is the systemic arterial elastance plotted when IABP ratio was set to 1:2 (1:4). Window [B] ([C]) shows aortic (red lines) and ventricular pressures when IABP ratio was set to 1:4 (1:8). (b) Screen output from CARDIOSIM© software simulator showing right ventricular loops. The red (blue) loops were obtained when IABP ratio was set to 1:4 (1:8).


