
Fig. 3. Experimental validation of randomly selected eccDNA identified by ATAC-seq in C4-2B and OVCAR8 cells.
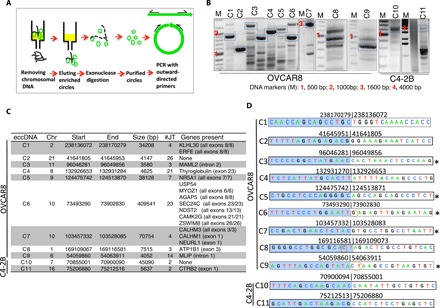
(A) Schematic for isolation and detection of eccDNA. See Materials and Methods for details. (B) PCR detection of eccDNA. DNA bands marked with blue boxes were gel-purified and sequenced. (C) Description of eccDNAs validated in (B) on the basis of analysis of ATAC-seq data from OVCAR8 and C4-2B. (D) Junctional tags obtained after sequencing of PCR products in (B). Shaded (blue) and unshaded sequences depict 15 bases on either side of junctions. Numbers indicate chromosomal location on respective chromosomes. Note the match between numbers for each circle in (C) and (D). Some of the junction sequence identified by Sanger sequencing differ by few bases because of multiple species of eccDNA present in the given cell lines. Oval circles represent insertion, and boxed sequences represent mismatches. *Sequence obtained from the bottom strand.