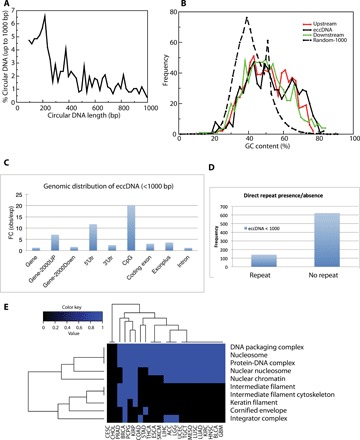
Fig. 5. Properties of microDNA identified in this paper (eccDNA <1 kb) by ATAC-seq.

(A) Length distribution of eccDNA shows peaks at 180 and 380 bases. (B) GC content of eccDNA locus and regions immediately upstream and downstream from the eccDNA is higher than genomic average, as calculated from 1000 random stretches of the genome of equivalent length as the eccDNA (Random-1000). (C) The sites in the genome that give rise to small eccDNA are enriched relative to random expectation in genic sites, sequences 2 kb upstream from genes and in CpG islands. FC, Fold Change. (D) Direct repeats of 2 to 15 bp flanking the genomic locus of the eccDNA at ligation point are present for ~20% of the loci. (E) Gene classes enriched in the set of genes found on the circular DNAs in two or more cancers. The color scale indicates enrichment in pathway (blue color indicates pathway was enriched). If the genes found on the eccDNA/duplication loci in a cancer type are significantly enriched in the indicated pathways, then the color in the cell is blue. If the set of genes is not enriched in that cancer, then the cell is black.
