
Fig. 6. Antitumor mechanism in vivo.
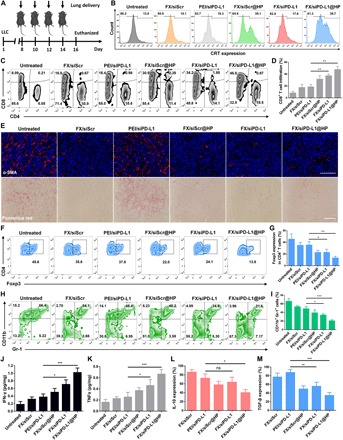
(A) After implantation of LLC cells, the treatments were given on days 8, 10, 12, and 14, and the mice were euthanized to collect the tumors on day 16 for further analysis. (B) CRT exposure of LLC cells. (C and D) Percentages and representative flow cytometry plots of CD4+ and CD8+ T cells in tumors. (E) α-SMA immunofluorescence staining and picrosirius red staining of the collected tumors after different treatments (scale bars, 100 μm). (F and G) Percentages and representative flow cytometry plots of Tregs in tumors. (H and I) Percentages and representative flow cytometry plots of MDSCs in tumors. (J) IFN-γ and (K) TNFα expression detected by ELISA. (L) IL-10 and (M) TGF-β expression analyzed by immunofluorescence staining. The IL-10 expression and TGF-β expression of the untreated group were set as 100%. Data were analyzed with unpaired t test, *P < 0.05, **P < 0.01, ***P < 0.001, ns. not significant.