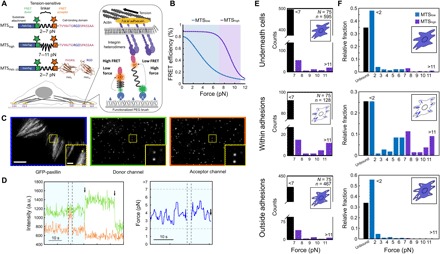
Fig. 1. Single-molecule tension measurements in living cells reveal distinct subpopulations of load-bearing integrins.

(A) FRET-based MTSs. MTSs are attached to the coverslip surface via the HaloTag domain. (B) FRET-force calibration curves for MTSlow (blue) and MTShigh (purple) (16, 51). (C) Representative images showing green fluorescent protein (eGFP) (left), FRET donor (middle), and acceptor channels (right) for HFFs adhering to a surface functionalized with MTSlow. Scale bar, 5 μm; inset scale bar, 2 μm. (D) Example intensity traces (left) for the FRET donor (green) and acceptor (orange). Vertical dashed lines delineate frames during which the acceptor dye was directly excited with 633-nm light; arrows mark acceptor or donor bleaching; horizontal gray dashed lines indicate upper and lower force measurement limits. Right: Corresponding load time series before acceptor photobleaching (light blue). Intensity, arbitrary units (a.u.). (E) Single-molecule load distributions for MTShigh underneath cells, within adhesions, and outside adhesions. N = number of cells, n = number of sensors. (F) Combined single-molecule load distributions for MTSlow and MTShigh sensors underneath cells, within adhesions, and outside adhesions for MTSlow [blue; data from (14)] and MTShigh (purple).
