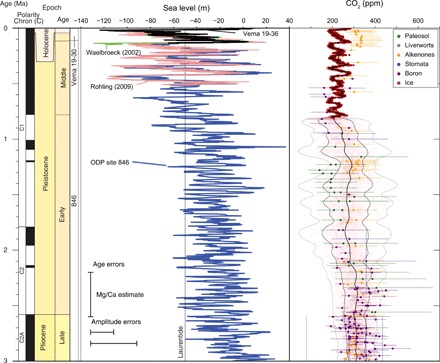
Fig. 3. Blowup of Quaternary GMSL and CO2 estimates.

Each site has a contrasting shade of blue, with the site number indicated on the left column in the corresponding color. Sea-level estimates of Waelbroeck et al. (94) (green) based on deep-sea δ18O and Rohling et al. (95) based on scaling of Red Sea data (magenta) are shown. The black line is the prediction of CO2 through time based on the data compiled by Foster et al. (47), and the dashed and dotted lines demarcate the 1σ and 2σ confidence intervals for that prediction, respectively. The Laurentide line is drawn at −50 m.
