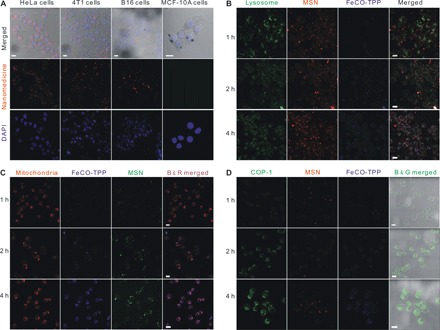
Fig. 3. Targeted delivery and controlled release profiles in vitro.

(A) CD44-dependent targeted endocytosis behaviors of the FeCO-TPP@MSN@HA nanomedicine shown by representative confocal fluorescence microscopy images of HeLa, 4T1, B16, and MCF-10A cells incubated with the FeCO-TPP@MSN-RITC@HA for 4 hours and stained for cellular nuclei with 4,6-diamino-2-phenylindole (DAPI). Therein, the MSN carrier was labeled with red RITC and then used to construct the FeCO-TPP@MSN-RITC@HA nanomedicine. (B) Intralysosome acid-responsive prodrug release behaviors of the FeCO-TPP@MSN@HA nanomedicine shown by the fluorescence images of HeLa cells treated with QL-FeCO-TPP@MSN-RITC@HA for the different time periods and stained with LysoTracker (green). Therein, the FeCO-TPP prodrug was labeled with blue QL (8-mercaptoquinoline). The increases in yellow and blue represent the lysosomal uptake of the nanomedicine and the FeCO-TPP prodrug release from lysosome, respectively. (C) Mitochondria-targeted prodrug delivery behaviors of the FeCO-TPP@MSN@HA nanomedicine shown by the fluorescence images of HeLa cells treated with QL-FeCO-TPP@MSN@HA for the different time periods and stained with MitoTracker (red). The increase in purple represents the mitochondrial uptake of the released FeCO-TPP prodrug. (D) Intramitochondrial CO release behaviors of the FeCO-TPP drug released from the FeCO-TPP@MSN@HA nanomedicine shown by the fluorescence images of HeLa cells treated with QL-FeCO-TPP@MSN-RITC@HA for the different time periods and stained with the COP-1 probe for detection of CO (green). The increase in green represents the release of CO. Scale bars, 20 μm.
