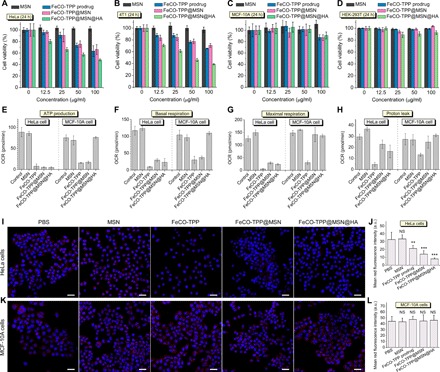
Fig. 4. In vitro selective anticancer effects and mechanisms of the FeCO-TPP@MSN@HA nanomedicine.

(A to D) Cytotoxicity of the FeCO-TPP@MSN@HA nanomedicine to cancer (HeLa and 4T1 cells) and normal (MCF-10A and HEK-293T cells) model cell lines. (E to H) Cell energy metabolism evaluation by ATP production (E), basal respiration (F), maximal respiration (G), and proton leak (H). (I and K) Confocal images of treated HeLa and MCF-10A cells where nuclei and mitochondria were stained into blue and red, respectively. (J) and (L) were the quantification of red fluorescence intensity in (I) and (K), respectively. Mean value and error bar were represented as means ± SD. P values were calculated by the two-tailed Student’s t test (**P < 0.01 and ***P < 0.001; NS, no significant difference). Scale bars (I and K), 20 μm. OCR, oxygen consumption rate.
