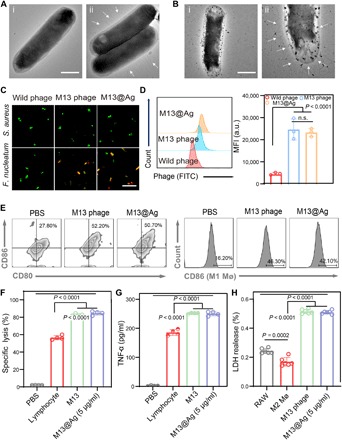
Fig. 4. In vitro activation of anticancer immune responses by M13@Ag.

(A and B) TEM images of Fn (A-i), M13 phages targeting Fn (A-ii), and M13@Ag targeting Fn (B-i and B-ii). The filamentous M13 phages were indicated with white arrows. Scale bars, 1 μm. (C) Confocal fluorescence images of phage-binding assays of M13 phages and M13@Ag toward different species of bacteria. Phages were marked with red fluorescent Cy5, and bacteria were labeled with green fluorescent FITC, respectively. Scale bar, 30 μm. (D) Flow cytometry for quantification of the targeting capacity of M13@Ag after coincubating with Fn and M13@Ag for 30 min. Phages were stained with green fluorescent FITC (n = 3). (E) Representative flow cytometry images for evaluating the DC maturation and TAMs toward M1 phenotype. BMDCs and M2 macrophages were incubated with M13 phages or M13@Ag for 24 hours (n = 3). Efficacy of immune responses for CTL-mediated cancer cell–specific lysis (F) and cytokine production levels of TNF-α (G) measured by incubating M13 phage–stimulated splenocytes with CT26 tumor cells for 24 hours. The supernatant was collected to detect the LDH leakage level and TNF-α level, with cytotoxic lymphocytes toward CT26 cells with an effector/target ratio of 20:1 (n = 4). (H) In vitro anticancer effects of M13 phage–polarized M1 macrophages measured by LDH assay after coculture with CT26 cells at the ratio of 20:1 (n = 6). Significant differences were assessed in (F), (G), and (H) using one-way ANOVA and t test and in (D) using t test. The mean values and SD are presented. MFI, mean fluorescence intensity.
