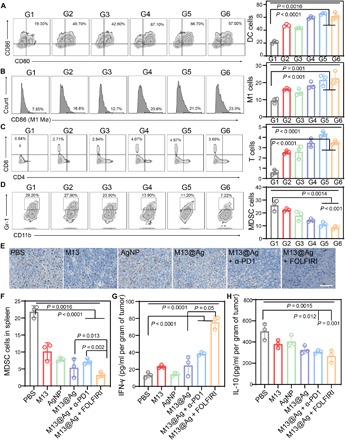
Fig. 6. M13@Ag reversed immunosuppressive TME for activation of antitumor immune response.

Orthotopic CT26-luc tumors were harvested from mice at 14 days after different treatments. Representative flow cytometric analysis images (left) and relative quantification (right) of infiltrating immune cells within tumor tissues as indicated. G1, PBS; G2, M13; G3, AgNP; G4, M13@Ag; G5, M13@Ag + α-PD1; G6, M13@Ag + FOLFIRI. (A) The mature of double-positive CD80+CD86+ dendritic cell gating on CD11c+ cells (n = 3). (B) TAM of classical activation M1 phenotype highly expressed CD86 (gated on CD11b+ cells) (n = 3). (C) The level of tumor infiltration CD8+ cytotoxic T cells gating on CD3+ cells (n = 3). (D) Percentage of CD11b+Gr-1+ MDSCs in the total of CD45+ lymphocytes (n = 3). (E) Immunohistochemistry staining images for arginase-1 (Arg-1) expression with immunosuppressive cells in different groups. (F) Relative quantification of MDSCs in spleen. (G and H) Secretion levels of IL-10 and IFN-γ in different treated groups (n = 3). Significant differences were assessed in (A) to (D) and (F) to (H) using one-way ANOVA and t test. The mean values and SD are presented.
