
Fig. 2. Quantification of color change.
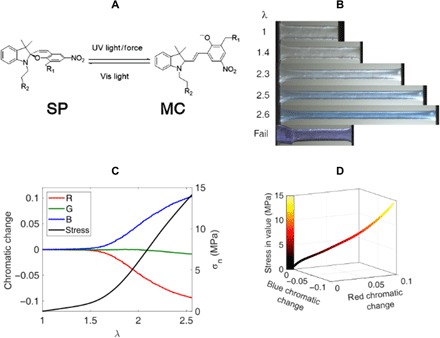
(A) Scheme of the SP and MC molecules. Vis, visible. (B) Images taken at different values of stretch. Photo credits: Yinjun Chen and C. Joshua Yeh (ESPCI Paris). (C) Chromatic change as a function of stretch for the images extracted from the video of uniaxial extension. (D) Calibration curve for the stress as a function of the blue and red chromatic change. All tests were carried out for the EA0.5-0.05(2.23) materials.