
Fig. 6. Comparison of experimental and simulated stress maps.
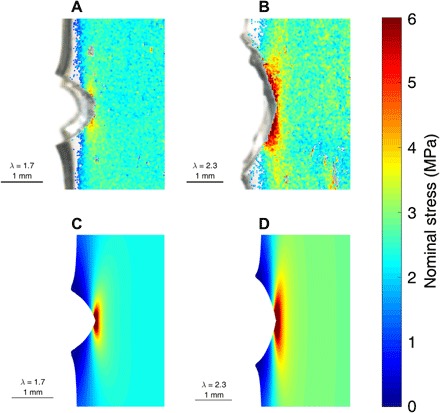
The experimentally obtained stress map of (A) the EA0.5-0.05(2.23) and (B) the EA0.2-0.05(2.61) fracture samples. The simulated stress map of (C) the EA0.5-0.05(2.23) and (D) the EA0.2–0.05(2.61) fracture samples.