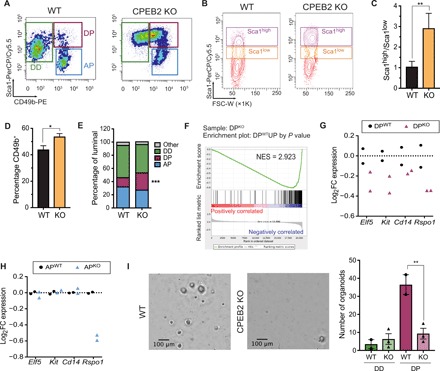
Fig. 2. CPEB2 KO females display aberrant Sca1+ ductal luminal progenitors.

(A) Representative fluorescence-activated cell sorting (FACS) plots gated on luminal cells depicting luminal subpopulations: ductal differentiated (DD; Sca1+CD49b−), ductal progenitors (DPs; Sca1+CD49b+), and alveolar progenitors (APs; Sca1−CD49b+). (B) Representative FACS plots for Sca1 gated on luminal cells. FSC-W, forward scatter width. (C) Ratio of the percentage of Sca1high and Sca1low populations in luminal cells (n = 10). Statistics were determined using the Mann-Whitney test, **P < 0.01. (D) Quantification of the percentage of CD49b+ cells gated on luminal cells (n = 17). Statistics were determined using the Mann-Whitney test, *P < 0.05. (E) Quantification of the luminal subpopulations as in (A). Statistics were determined using two-way ANOVA, ***P < 0.001 (n = 17). (F) Preranked GSEA graphical output for the enrichment in DPKO versus DPWT cells of the up-regulated genes in the “WT progenitor signature” generated by P value (n = 181, see Methods). FDR q ≤ 0.0001. FDR, false discovery rate; NES, normalized enrichment score. (G) Expression of luminal progenitor markers in DPWT and DPKO cells. (H) Expression of luminal progenitor markers in APWT and APKO cells. (I) Representative images of organoids from sorted DPWT and DPKO cells and automatic quantification of the number of organoids from sorted DD or DP cells. Scale bars, 100 μm. Statistics were determined using two-way ANOVA, **P < 0.01.
