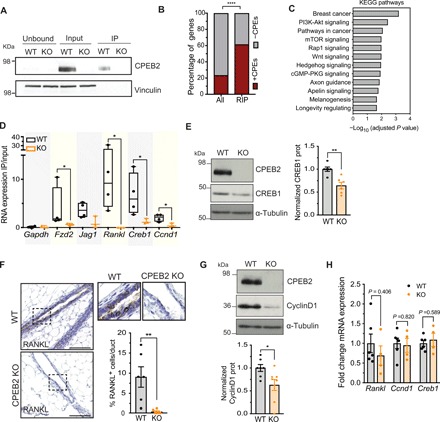
Fig. 4. CPEB2 regulates the synthesis of key effectors in the hormonal signaling pathways.

(A) Western blot image for CPEB2 and vinculin (as a control) from unbound, input, and immunoprecipitated fractions with anti-CPEB2 antibody in WT and CPEB2 KO MECs. (B) Percentage of genes with (+CPEs, red) or without (–CPEs, gray) CPEs in the 3′UTR, comparing RIP targets to the mouse transcriptome (all). Statistics were determined using Fisher’s exact test, ****P < 0.0001. (C) Significantly enriched KEGG pathways (adjusted P < 0.05) in the analyzed RIP targets. cGMP-PKG, cyclic guanosine monophosphate (cGMP)–cGMP-dependent Protein Kinase G (PKG). mTOR, mammalian target of rapamycin. (D) RIP-qPCR results showing the RIP values normalized by each input in WT (n = 4) and KO (n = 3) MECs. Gapdh mRNA and RIP in CPEB2 KO MECs are used as negative controls for enrichment in RIP as compared to input. Statistics were determined using the Mann-Whitney test, *P < 0.05. IP, immunoprecipitation. (E) Western blot image for CPEB2, CREB1, and α-tubulin (loading control) and normalized quantification of CREB1 protein levels in WT and KO MECs (n = 6). Statistics were determined using the Mann-Whitney test, **P < 0.01. (F) Representative images and manual quantification of RANKL+ cells by immunohistochemistry in adult virgin mammary gland in WT and CPEB2 KO animals (n = 6). Scale bar, 50 μm. Statistics were determined using the Mann-Whitney test, **P < 0.01. (G) Western blot image for CPEB2, CyclinD1, and α-tubulin (loading control) and normalized quantification of CyclinD1 protein levels in WT and KO MECs (n = 6). Statistics were determined using the Mann-Whitney test, *P < 0.05. (H) mRNA levels of Rankl, Ccnd1, and Creb1 normalized to Gapdh and to WT in MECs (WT, n = 6; KO, n = 4). Statistics were determined using the Mann-Whitney test.
