. 2020 May 1;9:e53895. doi: 10.7554/eLife.53895

Figure 1. Rspo1 and Rspo3 are expressed in embryonic kidneys and are required for normal development.

(A) RNA-Scope analysis demonstrates Rspo1 (i) and Rspo3 (iii) expression in the nephrogenic zone of developing (E14.5) kidneys. (B) RNA-Scope analysis followed by immunostaining for the progenitor marker SIX2 reveals a switch from strong Rspo3 expression within progenitors at E14.5 (i) to almost exclusively stromal progenitor expression at E18.5 (ii). In addition, strong staining was found within medullary stromal cells (iii). Hoechst stains nuclei in blue (C) Schematic outline of tamoxifen induction for CAGG:CreERTM-mediated deletion leading to a complete loss of R-spondin expression in the Rspo1/Rspo3 double mutant (DM). Colour legend: Purple for Rspo1+, pink for Rspo3+, dark red for Rspo1/Rspo3+ cells. Rspo depleted cells are dark grey, light grey highlights ureteric cells. (D) Macroscopic view of the urogenital system of Control and CAGG:CreERTM-DM embryos dissected at E18.5, (E). Hematoxylin and Eosin (Hand E) staining of E14.5 sections reveals smaller kidneys virtually lacking nephrons. A: adrenal gland, B: bladder, K: kidney, O: ovary, T: testis. CAGG:CreERTM-DM stands for (CAGG:CreERTM, Rspo1-/-, Rspo3fl/fl), Ctrl: Control.

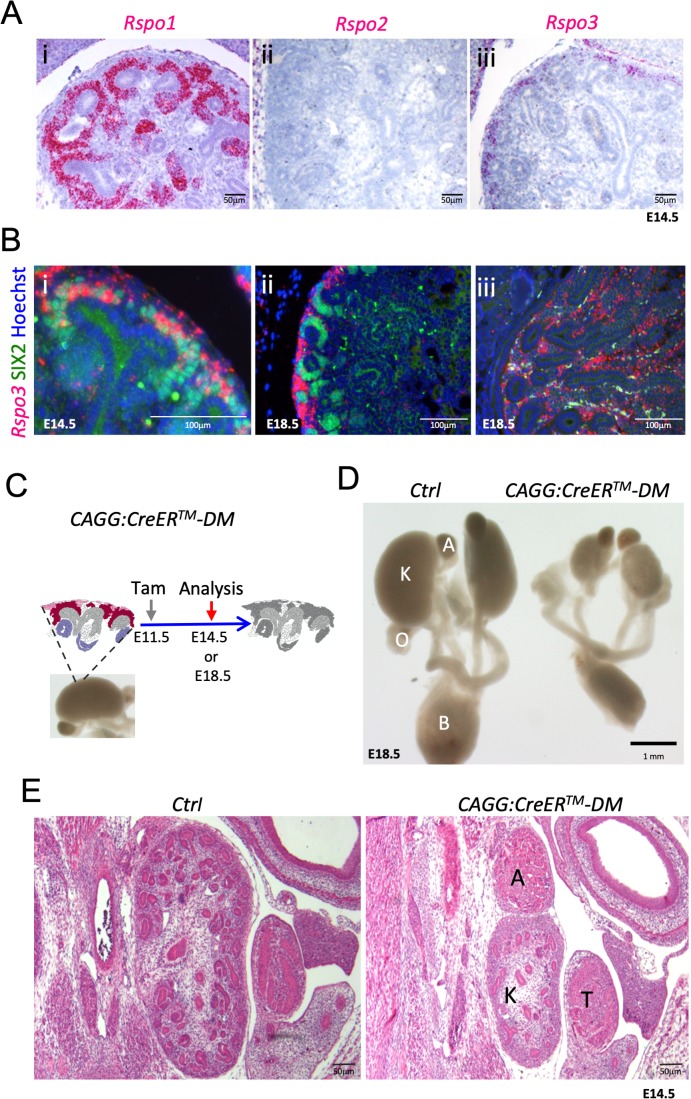
Figure 1.

Figure 1—figure supplement 1. R-spondin expression analysis during kidney development.

Figure 1—figure supplement 1.

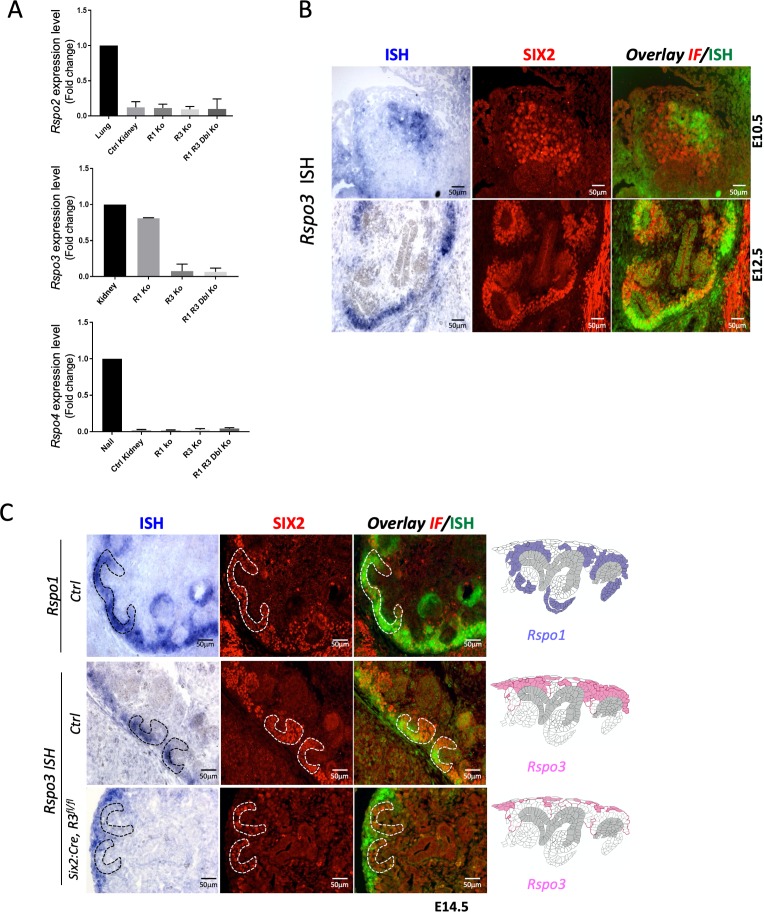
(A) qPCR analysis on wildtype (Ctrl Kidney), Rspo1-/- (R1 Ko), CAGG:CreERTM; Rspo3fl/fl (R3 Ko) and on CAGG:CreERTM, Rspo1-/-, Rspo3fl/fl (R1 R3 Dbl Ko). For the conditional Rspo3 allele, Tam induction was performed at E11.5 and kidneys were collected at E14.5. Data are expressed as fold change to highly expressing tissues (lung for Rspo2, kidney for Rspo3 and nail for Rspo4). In wildtype kidneys, strong Rspo3 expression was detected. By contrast, Rspo2 and Rspo4 showed little or no amplification, respectively. Tamoxifen-induced activation efficiently deleted Rspo3. No compensatory upregulation of family members was observed. A one-way ANOVA test was performed. Analysis was performed on kidney pairs isolated from three mouse embryos (n = 3) for all samples except for (R1 R3 Dbl Ko) n = 2. See Figure 1—figure supplement 1—source data 1. (B) Rspo3 is expressed in a subset of SIX2+ nephron progenitors. In situ hybridisation (ISH) analysis carried out on wildtype embryonic kidneys followed by immunofluorescent analysis. (C) In situ hybridisation (ISH) on E14.5 kidney sections prepared from control (Ctrl) and Six2:Cre, Rspo3fl/fl animals. Immunofluorescence (IF) staining with anti-SIX2 antibodies was achieved on same sections to identify renal progenitors (red). ISH and IF signals were overlaid (green and red, respectively). Expression patterns within the nephrogenic niche are schematized to the right of the panel. Note the persistence of Rspo3 expression in stromal cells upon progenitor-specific deletion (Six2-Cre, Rspo3fl/fl animals).
Figure 1—figure supplement 1—source data 1. Quantitative analysis of all R-spondin genes expression inRspo1andRspo3mutant kidneys.
Worksheet 1 : Quantification of Rspo2 expression in controls and Rspo1 and Rspo3 mutants kidneys.
Worksheet 2: Quantification of Rspo3 expression in controls and Rspo1 and Rspo3 mutants kidneys.
Worksheet 3: Quantification of Rspo4 expression in controls and Rspo1 and Rspo3 mutants kidneys.
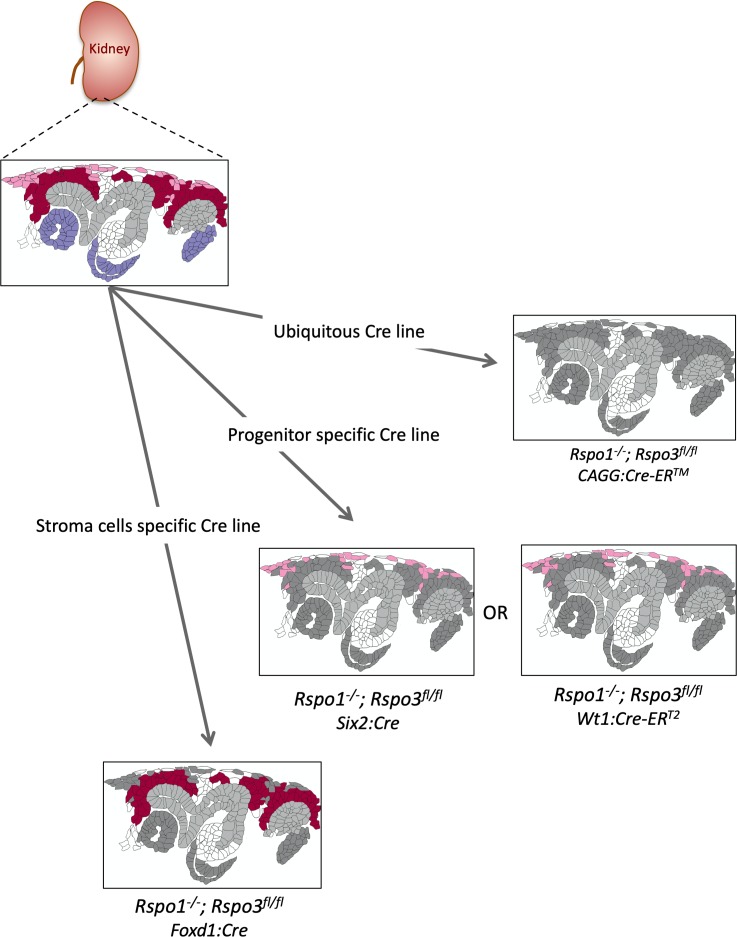
Figure 1—figure supplement 2. Schematic outline of the different genetic approaches used in this study.

Figure 1—figure supplement 2.

Expression patterns are labeled as follows. Rspo1 (only) = violet; stromal progenitor specific Rspo3 = light pink; nephron progenitor specific Rspo3 = dark red. Structures in dark grey represent cells that are depleted for Rspo1 and/or Rspo3. The branching collecting duct is depicted in light grey.
Figure 1—figure supplement 3. Rspo1 and Rspo3 are functionally redundant.

Figure 1—figure supplement 3.

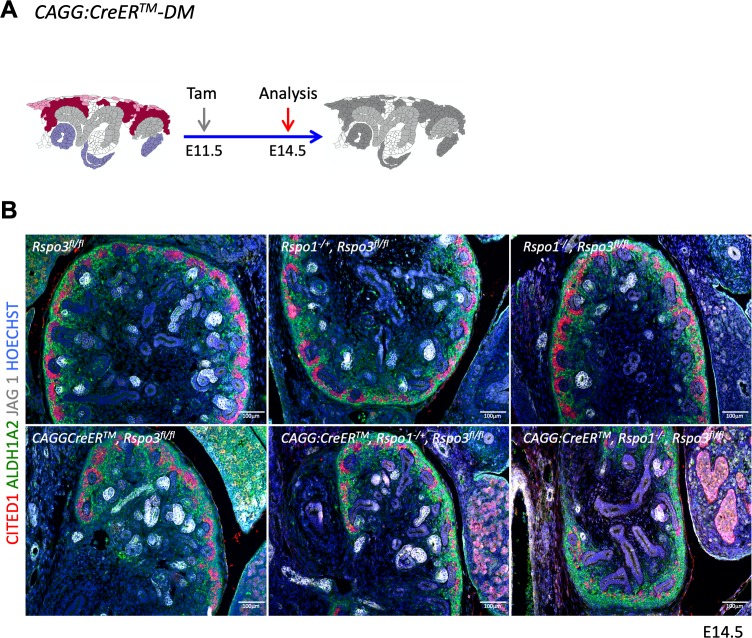
(A) Schematic outline of the experimental strategy. CAGG:CreERTM was activated by Tam at E11.5 and kidneys analyzed at E14.5. (B) Analysis of compound knockouts indicates that single gene deletion has only mild effects on progenitor survival and kidney formation. Dramatic loss of progenitors occurs when both genes are lost. Immunolabelling for RALDH1A2 (stromal cells in green), CITED1 (progenitors in red) and JAG1 (median segment of RV), comma/S-shaped bodies = white). Nuclei were counterstained with Hoechst (blue).