. 2020 May 1;9:e53895. doi: 10.7554/eLife.53895

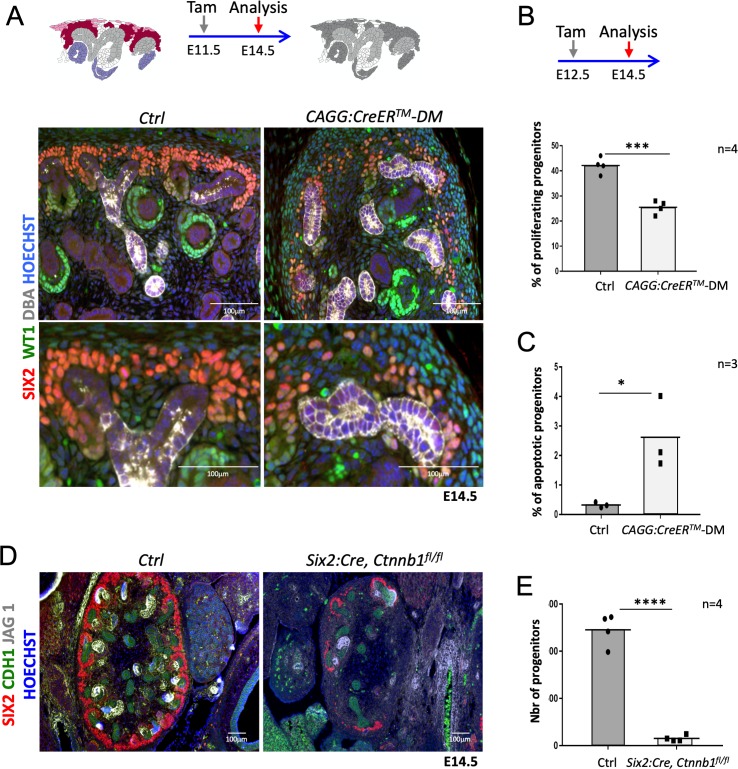
Figure 2. R-spondins are required for renal progenitor maintenance.

(A) Immunofluorescent analysis at E14.5 (induced at E11.5) reveals loss of SIX2+ progenitor cells and nascent nephrons (comma or S-shaped bodies) in CAGG:CreERTM-DM embryos. (WT1 = green; SIX2 = red; DBA = white; Hoechst = blue). Colour legend for the cartoon: Purple label Rspo1+, pink Rspo3+, dark red Rspo1/Rspo3+ cells. Rspo depleted cells are dark grey, light grey highlights ureteric cells. (B) Quantification of BrdU-labelled SIX2+ progenitors performed on four embryos (n = 4) demonstrates a significant reduction of proliferation 2 days after Rspo3 deletion. See Figure 2—source data 1 (C) TUNEL analysis reveals a dramatic increase in apoptosis (n = 3 embryos for each genotype, two litters). (D) Progenitor specific deletion of β-catenin (Six2:Cre; Ctnnb1fl/fl) results in the loss of progenitor cells at E14.5 (SIX2 = red; CDH1 = green; JAG1 = white). (E). Quantification of SIX2+ progenitors (n = 4 embryos for each genotype isolated from two litters). See Figure 2—source data 1. Columns are means ± SEM with p<0.05 (*), p<0.01 (**), p<0.001 (***), p<0.0001 (****). One black dot = average value for one control embryo, one black square = average value for one CAGG:CreERTM-DM embryo.

Figure 2—source data 1. Progenitors quantification inCAGG:CreERTM-DMand (Six2:Cre;Ctnnb1fl/fl) mutant kidneys.
Worksheet 1 - source data for Figure 2B: Quantification of proliferating (BrdU+) progenitor cells (SIX2+) in controls and CAGGCreERTM-DM
Worksheet 2 - source data for Figure 2C: Quantification of apoptotic (TUNEL+) progenitor cells (SIX2+) in controls and CAGGCreERTM-DM.
Worksheet 3 - source data for Figure 2E: Quantification of progenitor cells (SIX2+) in controls and mutant (Six2:Cre, Ctnnb1 fl/fl) samples.

Figure 2.

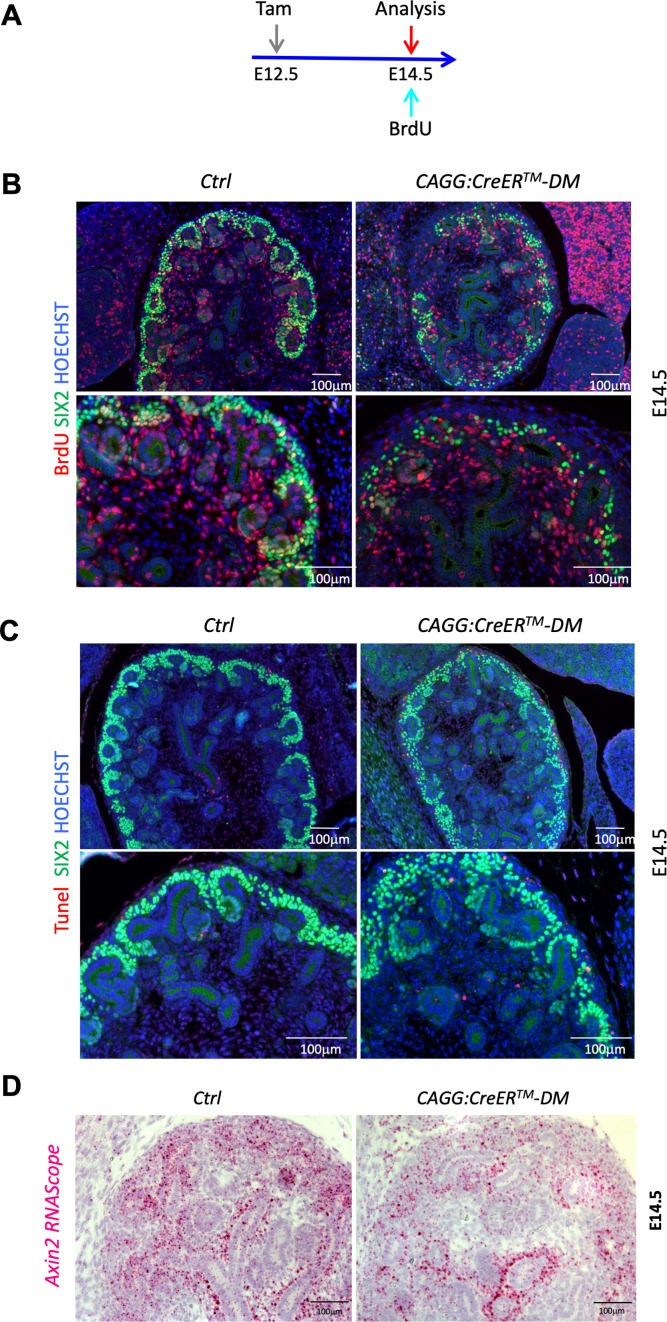
Figure 2—figure supplement 1. Proliferation and apoptosis analysis.

Figure 2—figure supplement 1.

(A) Schematic outline of the experimental strategy. To detect early events the CAGG:CreERTM was activated by Tam induction at E12.5, pregnant female received a BrdU injection and were sacrificed 2 hr later at E14.5. B) Representative images for the BrdU labelling quantification used in Figure 2B. Proliferating progenitors were immunodetected with SIX2 (green) and BrdU (red) antibodies. Nuclei were counter stained with Hoechst (blue). (C) Representative images for the TUNEL labelling quantification used in Figure 2C. Cells undergoing apoptosis were labeled with TUNEL assay (red), progenitors were stained with anti-SIX2 (green) antibodies. (D) RNAScope analysis demonstrates reduced Axin2 expression (pink and red signal) in the nephrogenic zone of developing kidney CAGG:CreERTM-DM mutants (E14.5). Cell nuclei were counterstained with Hematoxylin.