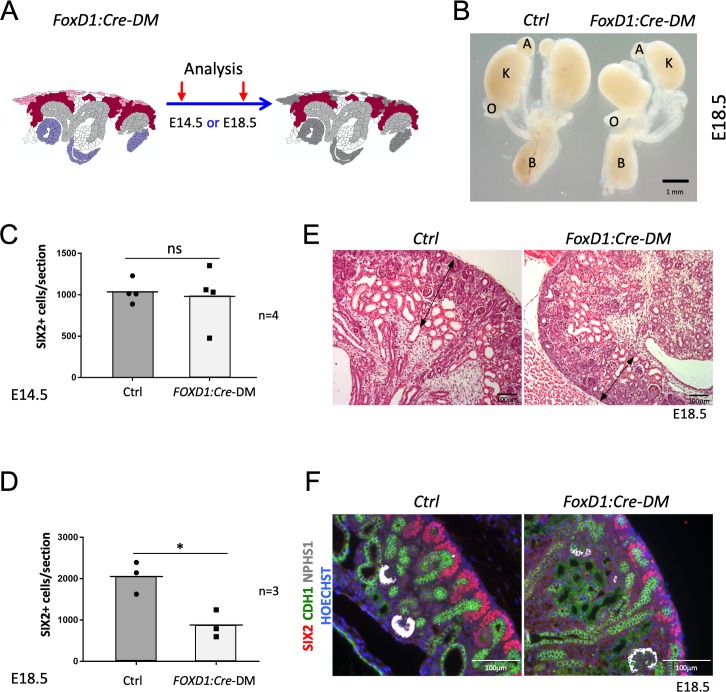
Figure 3. Stromal RSPO3 maintains the pool of renal progenitors at late stages of kidney development.
(A) Schematic outline of the strategy used for stromal-specific deletion of Rspo3 in the absence of Rspo1. (B) Macroscopic view of urogenital systems at E18.5 reveals smaller kidneys in Foxd1:Cre-DM mutants when compared to control littermates. (C) Quantification of SIX2+ progenitors reveals no significant difference in the number of progenitors between mutant and control kidneys at E14.5 (n = 4 embryos for each genotype, one litter), see Figure 3—source data 1 (D) but a more than 50% decrease by E18.5 (n = 3 embryos for each genotype, two litters), see Figure 3—source data 1. (E) H and E staining of kidney sections at E18.5 shows a reduction of the nephrogenic zone (double arrowed black lines). (F) IF analysis using anti-CDH1 (green) anti-SIX2 (red), and anti-NPHS1 (marks podocytes in white) antibody reveals a loss of progenitors. Nuclei were counterstained with Hoechst (blue). A: adrenal gland, B: bladder, K: kidney, O: ovary. Columns are means ± SEM with p<0.05 (*), p<0.01 (**), p<0.001 (***), p<0.0001 (****). Foxd1:Cre-DM stands for (Foxd1:Cre, Rspo1-/-, Rspo3fl/fl) double mutant, Ctrl: Control.

