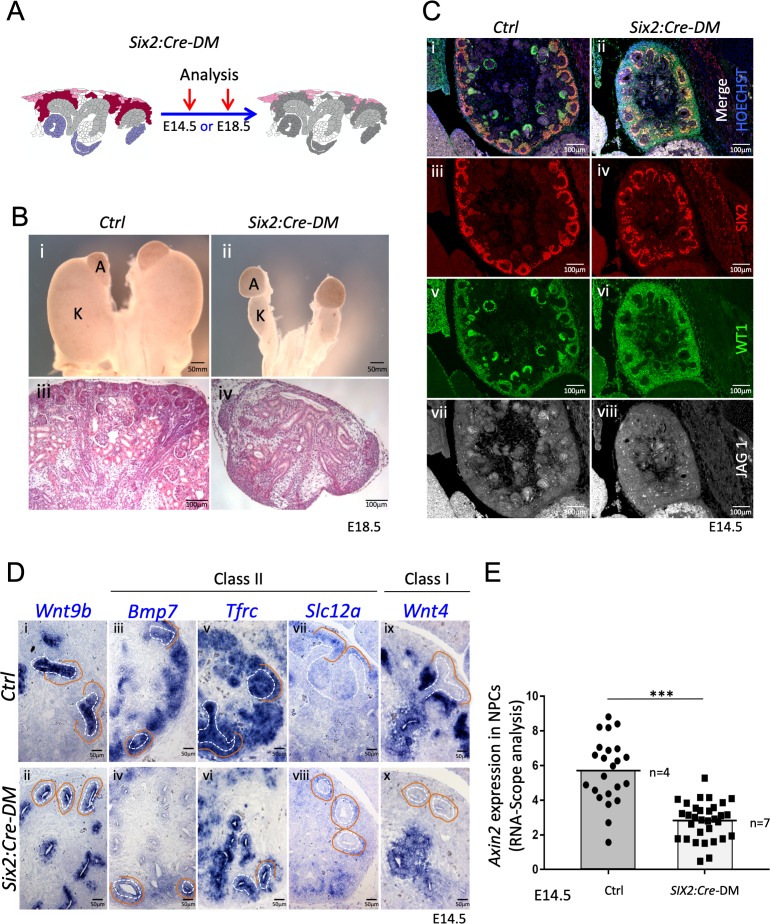
Figure 4. Absence of R-spondins from progenitors causes lack of MET and downregulation of β-catenin target genes.
(A) Schematic outline of the strategy used for progenitor-specific deletion of Rspo3. Six2:Cre-DM stands for (Six2:Cre, Rspo1-/-, Rspo3fl/fl). (B) Macroscopic view reveals smaller kidneys (K) in mutant E18.5 embryos. H and E staining reveals a complete absence of glomeruli (compare iii and iv). (C) Immunolabelling for SIX2 (red), WT1 (green) and JAG1 (white) revealed a mild reduction of progenitors and confirmed the lack of nephrons on the molecular level (D). In situ hybridization performed on E14.5 embryos revealed persistence of Wnt9b expression, but dramatic reduction of class I (Wnt4) and class II (Bmp7, Tfrc, Slc12a) β-catenin target genes in the nephrogenic lineage. Dotted white lines highlight the ureter and orange lines outline the CM compartment. (E) Quantification with RNA-Scope technology combined with Halo software analysis shows a reduction of Axin2 expression by 51% in the nephrogenic zone of mutant kidneys compared to control (p<0.0001). (n = 4 embryos isolated from four litters for control genotype, and n = 7 embryos isolated from six litters for mutant genotype). Each dot or square represents the total RNAScope signal detected per nephrogenic area normalised to the total number of cells present in this field. See Figure 4—source data 1. Columns are means ± SEM with p<0.05 (*), p<0.01 (**), p<0.001 (***), p<0.0001 (****).


