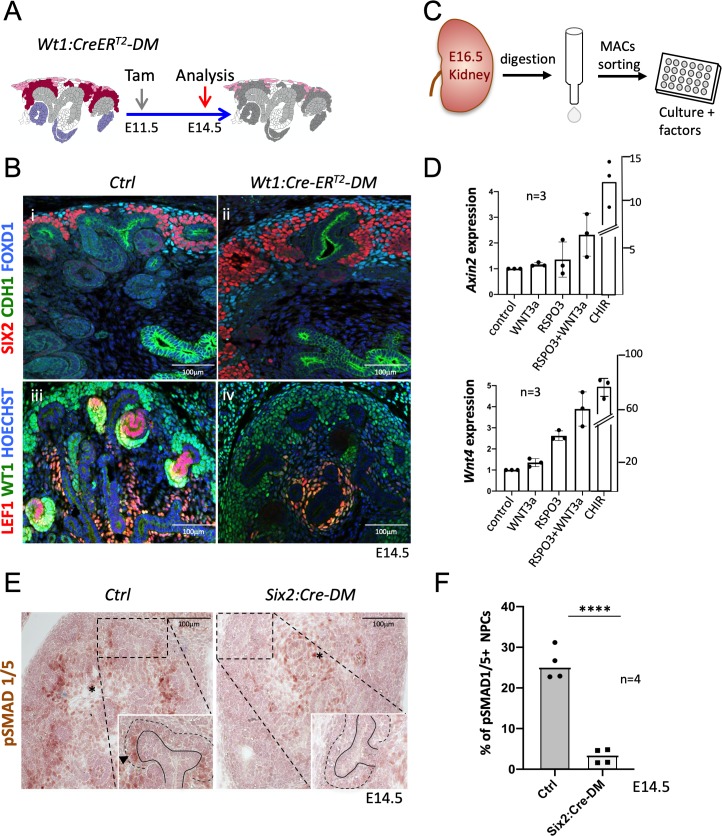
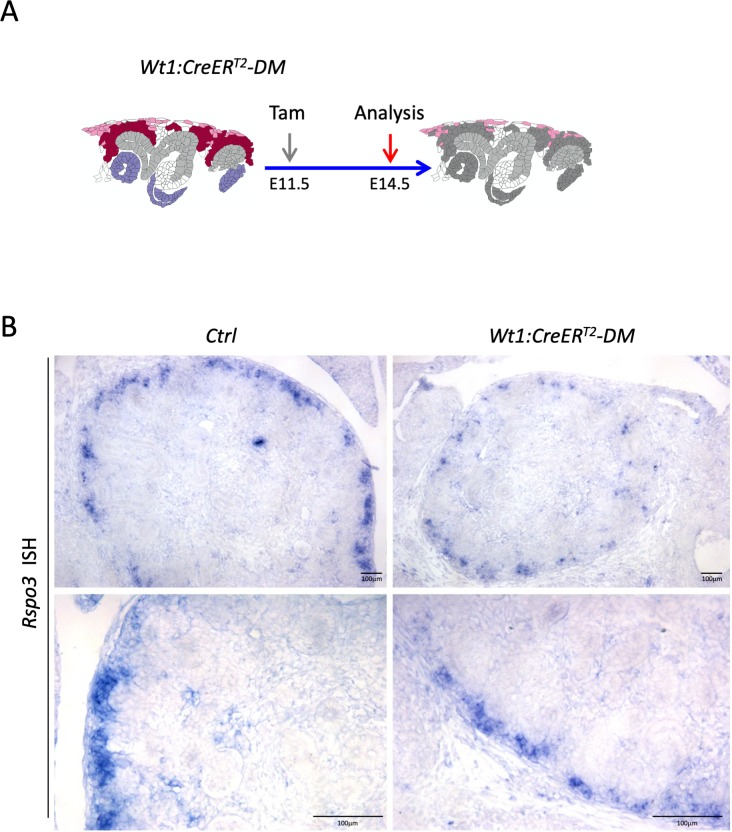
Figure 5. R-spondins are required for MET induction.
(A) Schematic outline of the strategy used for Wt1:CreERT2 induced deletion of Rspo3. Wt1:CreERT2-DM stands for (Wt1:CreERT2, Rspo1-/-, Rspo3fl/fl). (B) i and ii) Immunolabelling revealed lack of nephrogenesis upon Wt1:CreERT2 induced deletion of R-spondins, despite the persistence of large numbers of SIX2+ (red) nephron progenitors and FOXD1+ (blue) stroma progenitors (CDH1 = green). iii and iv) Staining for LEF1 (red) and WT1 (green) confirmed the lack of nephrogenesis (C) Schematic representation of the methodology followed to isolate and grow kidney progenitors in vitro. (D) Comparison of Axin2 or Wnt4 gene expression levels in nephron progenitors treated by recombinant protein WNT3a (50 ng/ml) or RSPO3 (200 ng/ml) alone, WNT3a and RSPO3 in combination or CHIR (3µM) alone as an internal positive control. Experiments were performed as triplicates (n = 3). Compared to control, addition of RSPO3 + WNT3A leads to a 2.3 fold and 4.6 fold increase of Axin2 and Wnt4 expression respectively, see Figure 5—source data 1. (E). Immunohistochemical analysis for pSMAD1/5 demonstrated the lack of nephron progenitor priming (black arrowhead). Note the persistence of pSMAD staining in medullary stroma (black asterisk). In the inset, black lines outline the ureter and dotted lines the CM compartment. (F) Quantification of progenitors that are pSMAD1/5+ reveals a highly significant reduction of SMAD1/5 phosphorylation in mutant compared to control kidneys at E14.5 (n = 4 embryos for each genotype, 3 and 4 litters for control and mutant respectively), see Figure 5—source data 1.


