. 2020 May 15;9:e55053. doi: 10.7554/eLife.55053

Figure 2. PhIP-Seq identifies novel (and known) antigens across multiple APS1 sera.

(A) Hierarchically clustered (Pearson) z-scored heatmap of all genes with 10-fold or greater signal over mock-IP in at least 3/39 APS1 sera and in 0/28 non-APS1 sera. Black labeled antigens (n = 69) are potentially novel and grey labeled antigens (n = 12) are previously literature-reported antigens.

Figure 2.

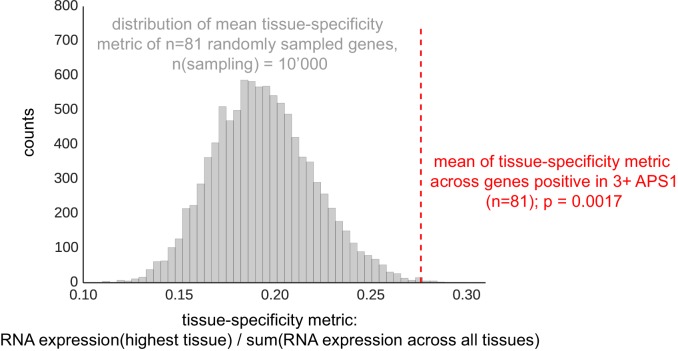
Figure 2—figure supplement 1. The mean of tissue-specificity ratio of 81 PhIP-Seq antigens (Figure 2) is increased as compared to the tissue-specificity ratio of n = 81 randomly sampled genes (n-sampling = 10’000).

Figure 2—figure supplement 1.

Data from Protein Atlas, HPA/Gtex/Fantom5 RNA consensus dataset (https://www.proteinatlas.org/about/downloadUhlén et al., 2015).