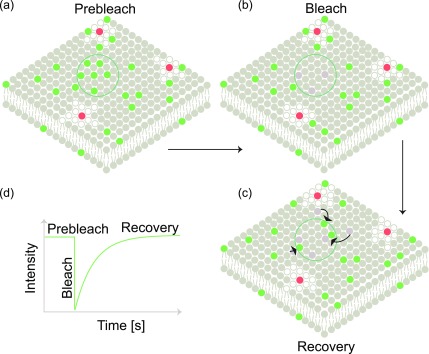
FIG. 1.
Fluorescence recovery after photobleaching: (a) a fractional area indicated by the green circle is photobleached leading to (b) depletion of fluorescent molecules in that area. (c) Fluorophores from the surrounding regions diffuse into the bleached area, leading to recovery of fluorescence in the marked green circular area. (d) Schematic intensity plot showing the pre-bleach intensity, bleaching, and recovery in the circular area.

