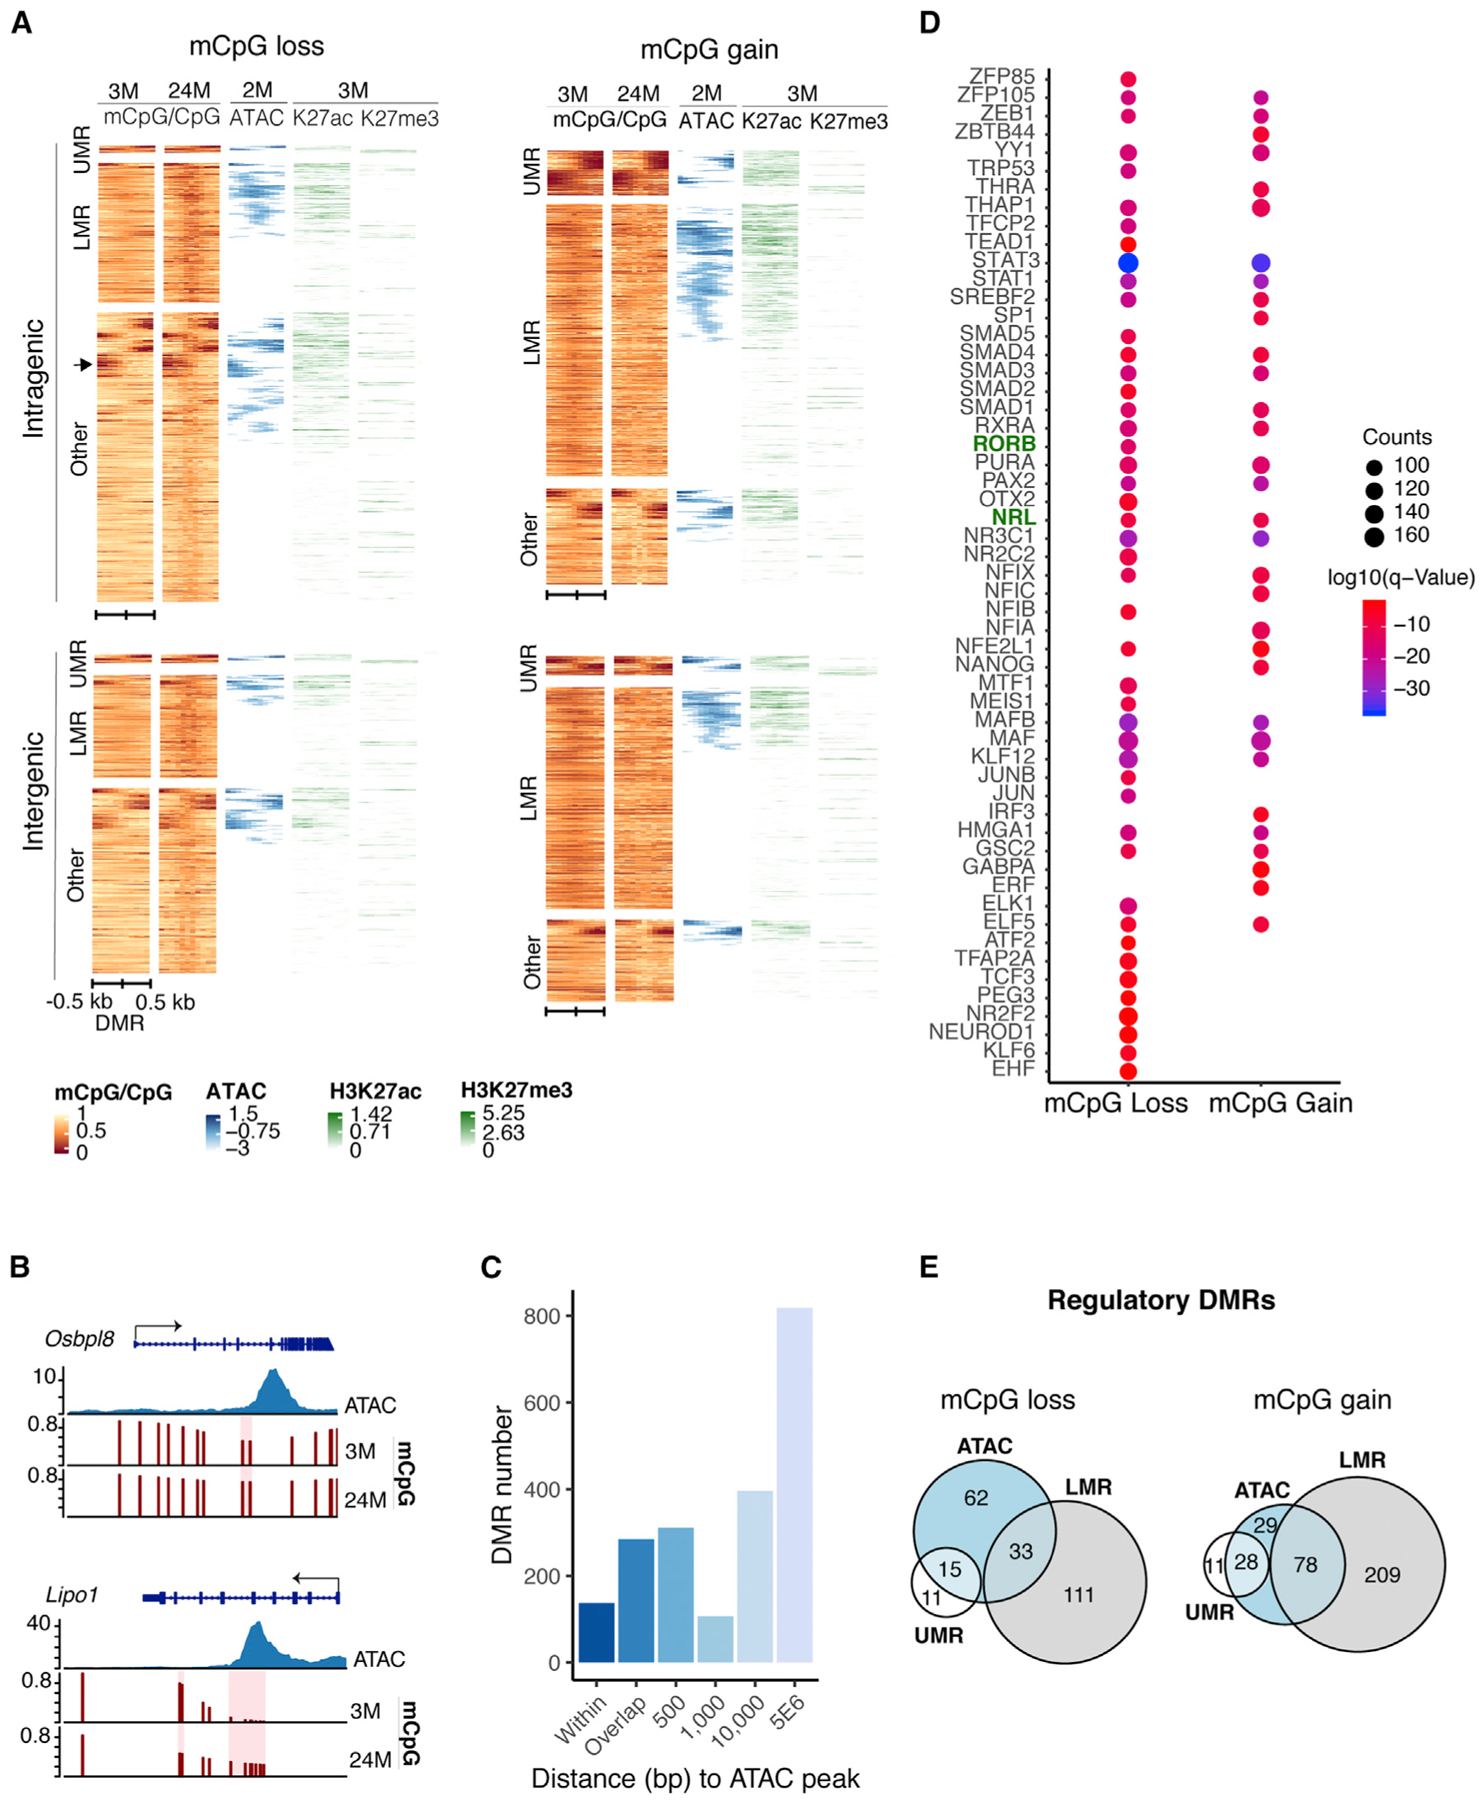
Figure 3. Age-Related DMRs Dominate in Rod Regulatory Regions.

(A) Heatmap showing chromatin features over a 1-kb region centered on intragenic or intergenic DMRs. DMRs often localize to open chromatin boundaries and harbor marks of active (H3K27ac) or repressed/poised (H3K27me3) regulatory elements. Color scale bar represents methylation levels in young (3-month-old) and old (24-month-old) mice, with red being low and yellow being high. Scale for ATAC-seq and histone modifications represents read density, with blue and green being high and white being low in 2-to 3-month-old rods (n = 6 for H3K27me3 and n = 4 for H3K27ac). ATAC-seq data were obtained from Mo et al. (2016). The arrow indicates an example of DMRs located at boundaries of ATAC-seq peaks.
(B) Examples of DMRs at boundary regions of ATAC-seq peaks in Osbpl8 or within ATAC-seq peaks in Lipo1.
(C) Distance of DMRs from ATAC-seq peaks. DMRs shown as “within” represent DMRs completely contained in ATAC-seq peaks.
(D) TF motifs enriched in DMRs. Top 20% enriched TFs are shown. p ≤ 0.01.
(E) Euler diagrams showing the numbers of intergenic DMRs overlapping with UMRs, LMRs, and ATAC-seq peaks (±<500 bp from ATAC-seq peak), herein referred to as regulatory DMRs.
