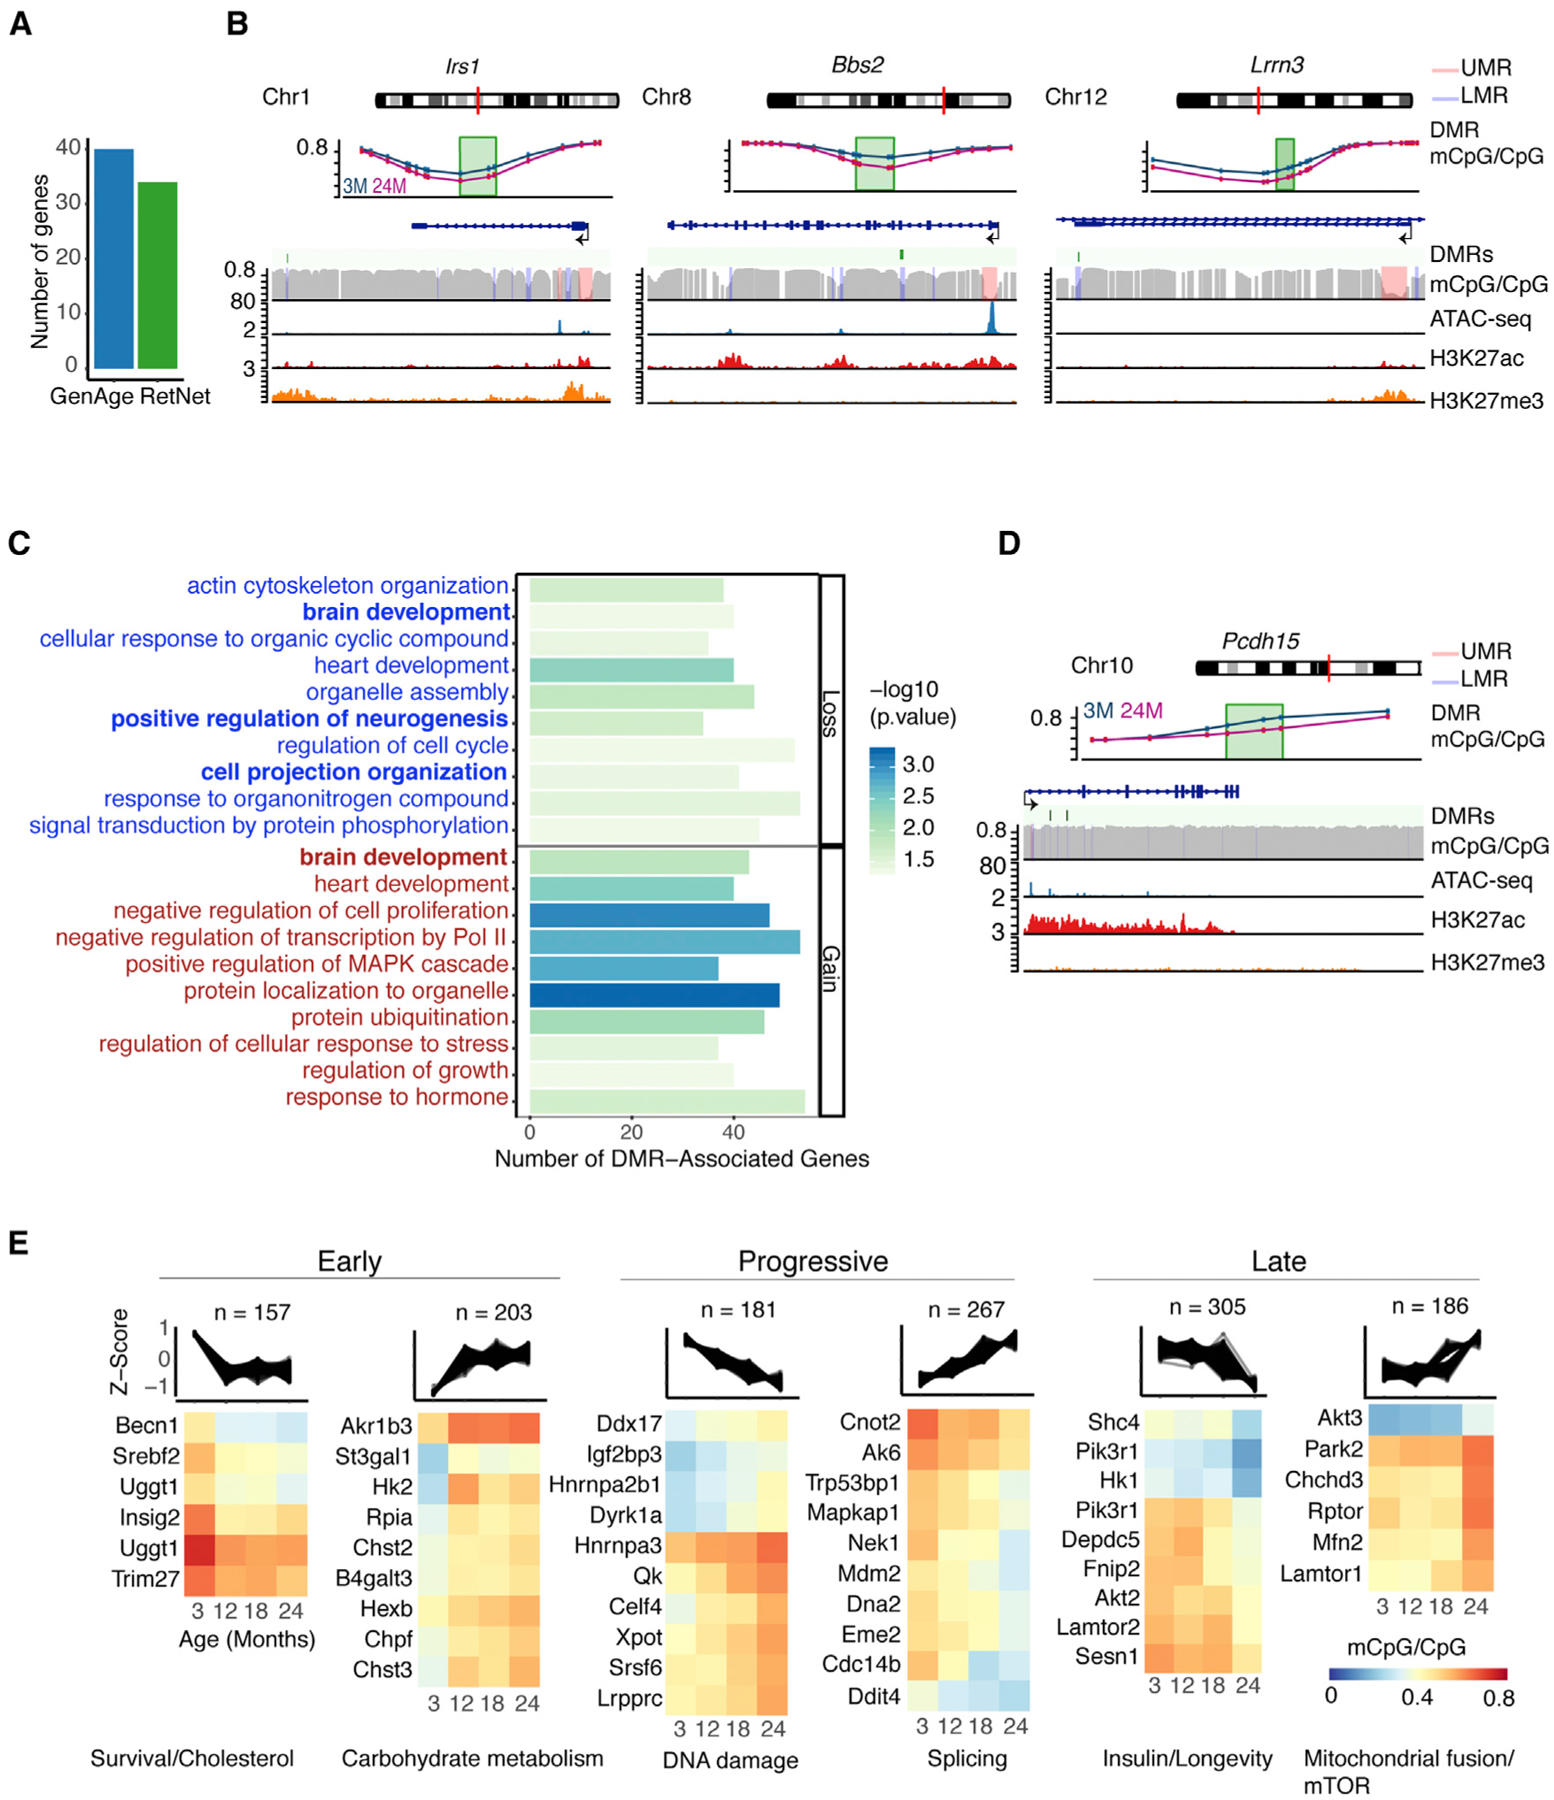
Figure 4. Aging Progression in Rods Correlates with Distinct Patterns of DMRs.

(A) Bar plot showing the number of DMR-associated genes related to aging (as reported in the GeneAge database: https://genomics.senescence.info/genes/) and retinal disease (as reported in the RetNet database: https://sph.uth.edu/retnet/).
(B) Examples of DMRs present in Irs1, Bbs2, and Lrrn3. Methylation levels at DMRs are shown for 3 and 24 months. CpG methylation, ATAC-seq, H3K27ac, and H3K27me3 profiles are shown for the 3-month time point over the respective genes and their surroundings.
(C) GO enrichment of genes associated with age-related DMRs.
(D) DMRs in Pcdh15 similar to those reported in (B).
(E) Age-related rod DMRs showing early, progressive, and late change patterns manually grouped from unsupervised clustering analysis (see Figure S5A). Examples of genes enriched in different pathways after GO analysis using gProfilerR are shown for each pattern of change (see Table S5).
