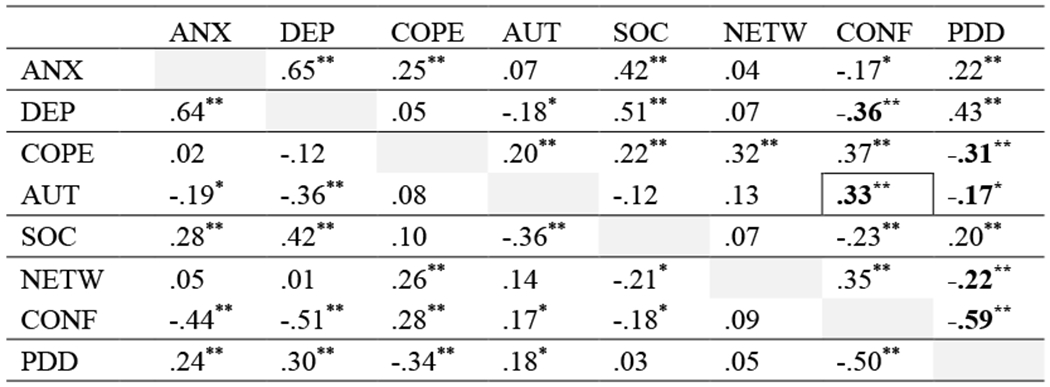
Table 2.
Correlations between variables, collapsed across time points
 |
p<.01 ;
p<.05
Values below diagonal are correlations among women in FS-CBT condition, values above the diagonal are correlations among women in GN-CBT; Bolded values reflect negative direct correlations which are positive in the network, Bolded and boxed values reflect positive direct correlations which are negative in the network
