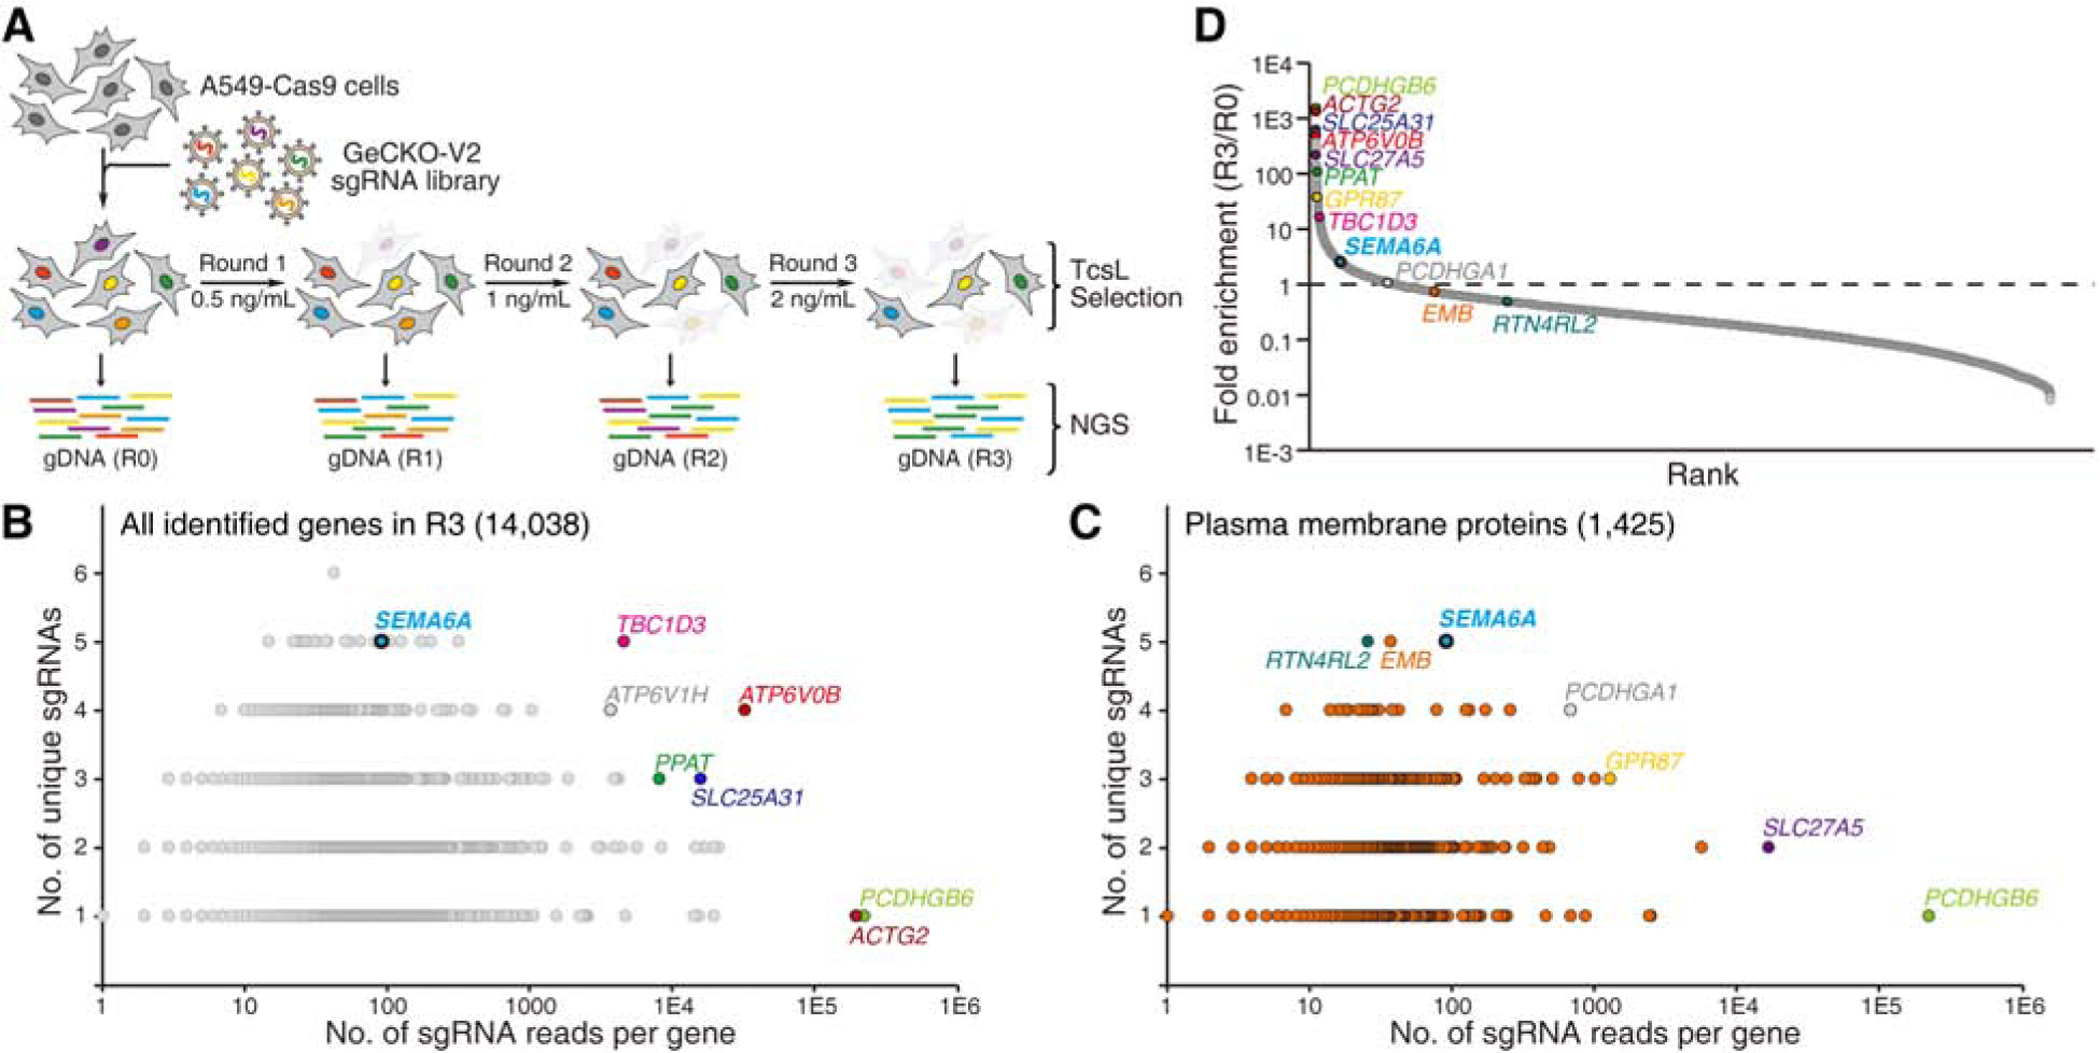
Figure 1. Genome-wide CRISPR-Cas9-mediated loss-of-function screen for TcsL.

(A) Schematic diagram of the screen process. A549 cells that stably express Cas9 (A549-Cas9) were transduced with lentiviral GeCKO-V2 sgRNA libraries. Cells were then selected with TcsL at 0.5 ng/mL for 24 h (Round 1, R1). Cells were recovered in toxin-free medium and then subjected to two more rounds of selection with TcsL (R2: 1 ng/mL and R3: 2 ng/mL). Cells of each round were harvested and sgRNA sequences were identified by NGS. Cells not treated with toxins served as a control (R0).
(B) Genes identified in R3 are plotted based on the number of unique sgRNAs (y axis) and total sgRNA reads (x axis). Selected top hits are marked and colored.
(C) A total of 1,425 genes identified in R3 are annotated as plasma membrane proteins. These proteins are plotted based on the number of unique sgRNAs (y axis) and total sgRNA reads (x axis). Selected top hits are marked.
(D) Genes identified in R3 are plotted based on their fold-enrichment from R0 to R3 (sgRNA reads of a gene among total sgRNA reads in R3 versus R0). Selected top hits in panels B and C are marked.
