
Figure 2. Validation of top hits identified in the screen.
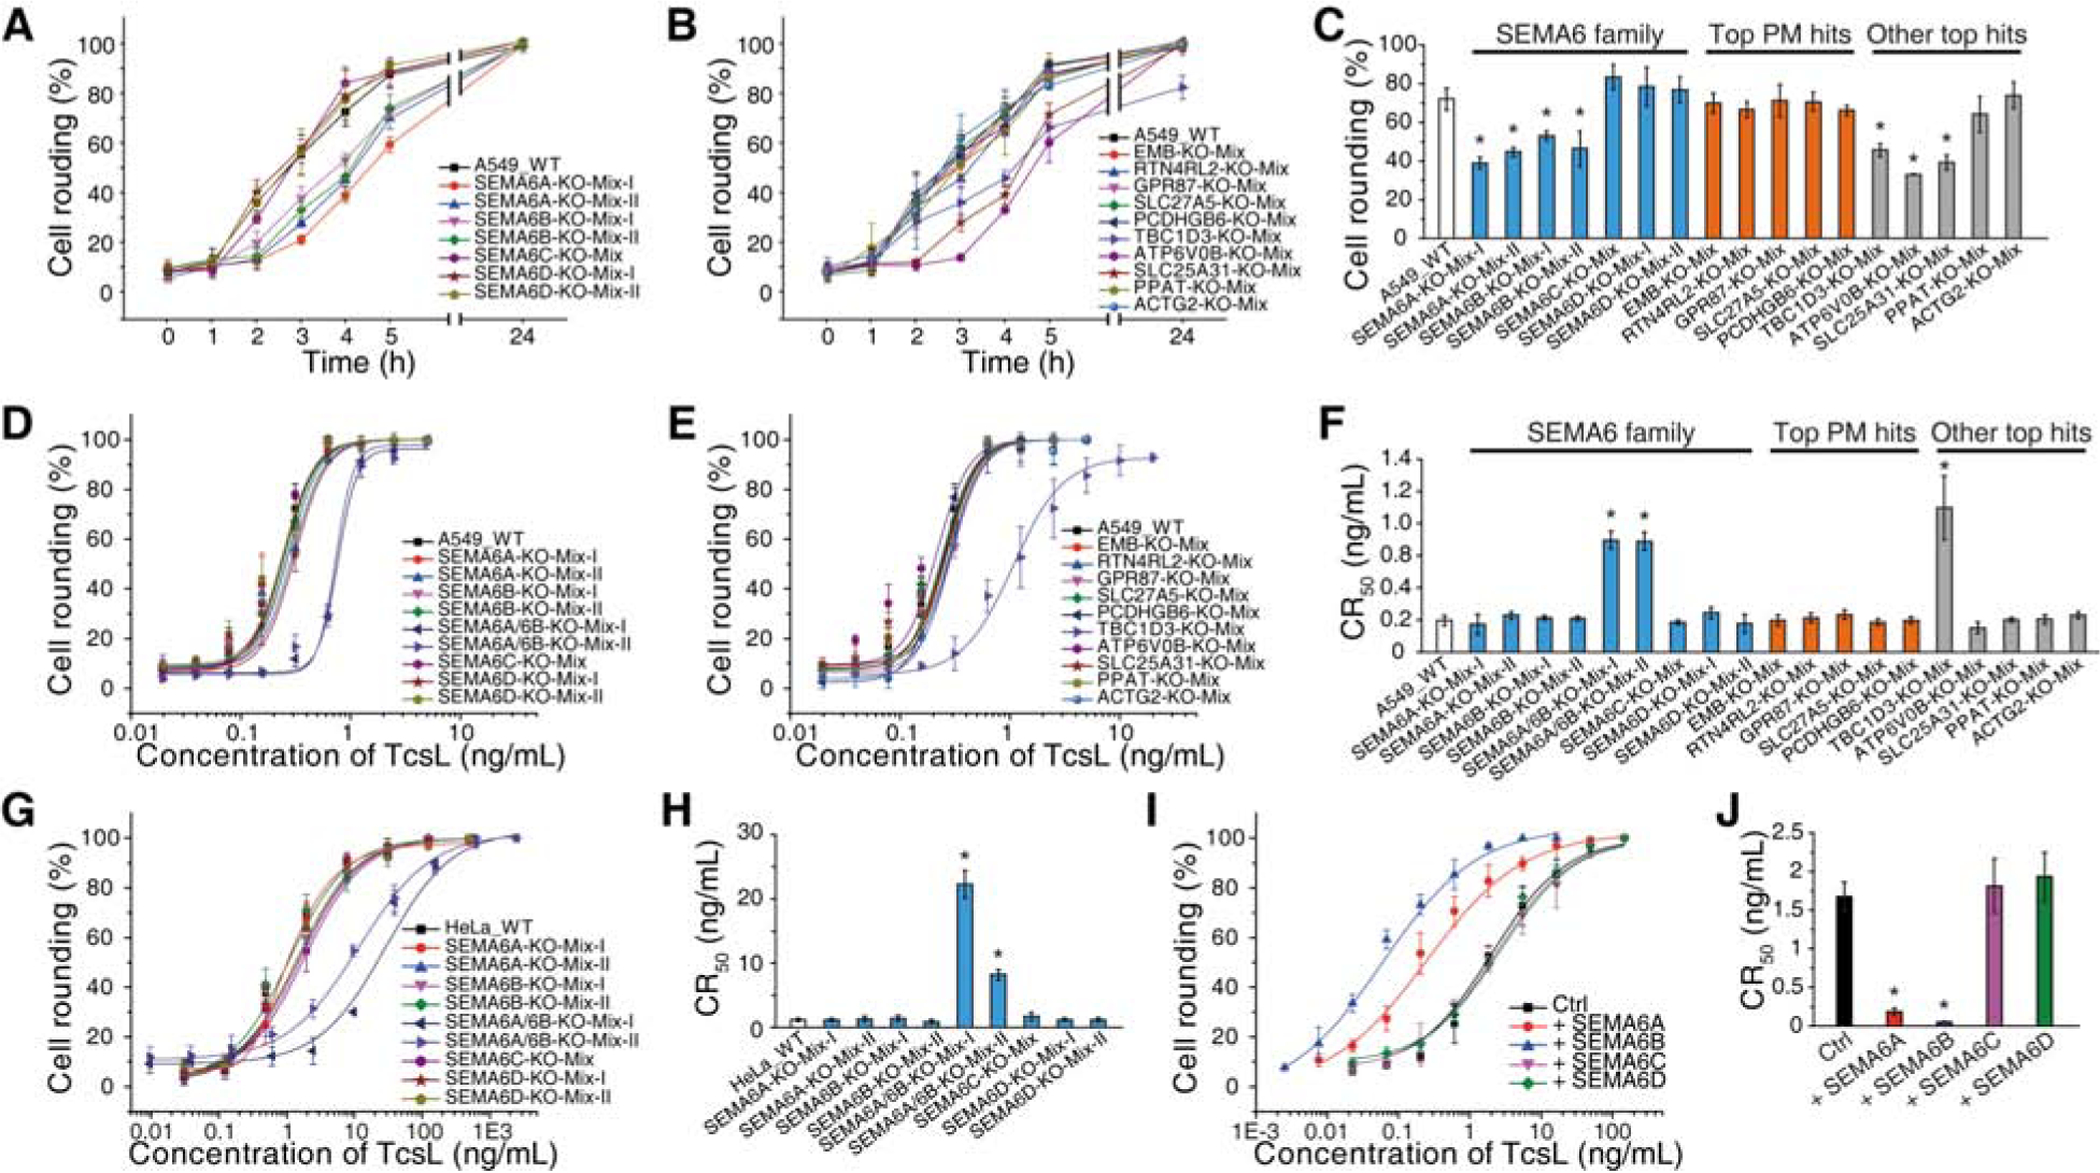
(A-C) Mixed stable A549 KO cells for the indicated genes were generated via the CRISPR-Cas9 approach. Two independent knockout cell lines using two different sgRNAs were generated for SEMA6A, 6B and 6D, one line was generated for 6C and other hits. The sensitivity of these cells to TcsL (10 ng/mL) were examined by quantifying cell rounding over time (A for SEMA6 family, B for other proteins). The percentages of cell rounding at 4 h post TcsL exposure are plotted as bar-chart in panel C. PM, plasma membrane. Error bars indicate mean ± s.d., N = 3, *, p < 0.01 (one-way ANOVA).
(D-F) Two independently generated SEMA6A and 6B double KO cell lines (SEMA6A/6B-KO-Mix-I and SEMA6A/6B-KO-Mix-II) and other indicated KO cell lines were exposed to TcsL for 24 h. The percentages of rounded cells were plotted over toxin concentrations. (D for SEMA6 family, E for other proteins). Their CR50 are plotted in a bar-chart (F). Error bars indicate mean ± s.d., N = 3, *, p < 0.01 (one-way ANOVA).
(G-H) Mixed stable HeLa KO cells for SEMA6 family genes were generated via the CRISPR-Cas9 approach and exposed to TcsL for 24 h (G). Their CR50 are plotted in a bar-chart (H). Error bars indicate mean ± s.d., N = 3, *, p < 0.01 (one-way ANOVA).
(I-J) HeLa cells overexpressing SEMA6 family proteins via lentiviral transduction were exposed to TcsL for 24 h (I). Their CR50 are plotted in a bar-chart (J). Error bars indicate mean ± s.d., N = 3, *, p < 0.01 (one-way ANOVA).