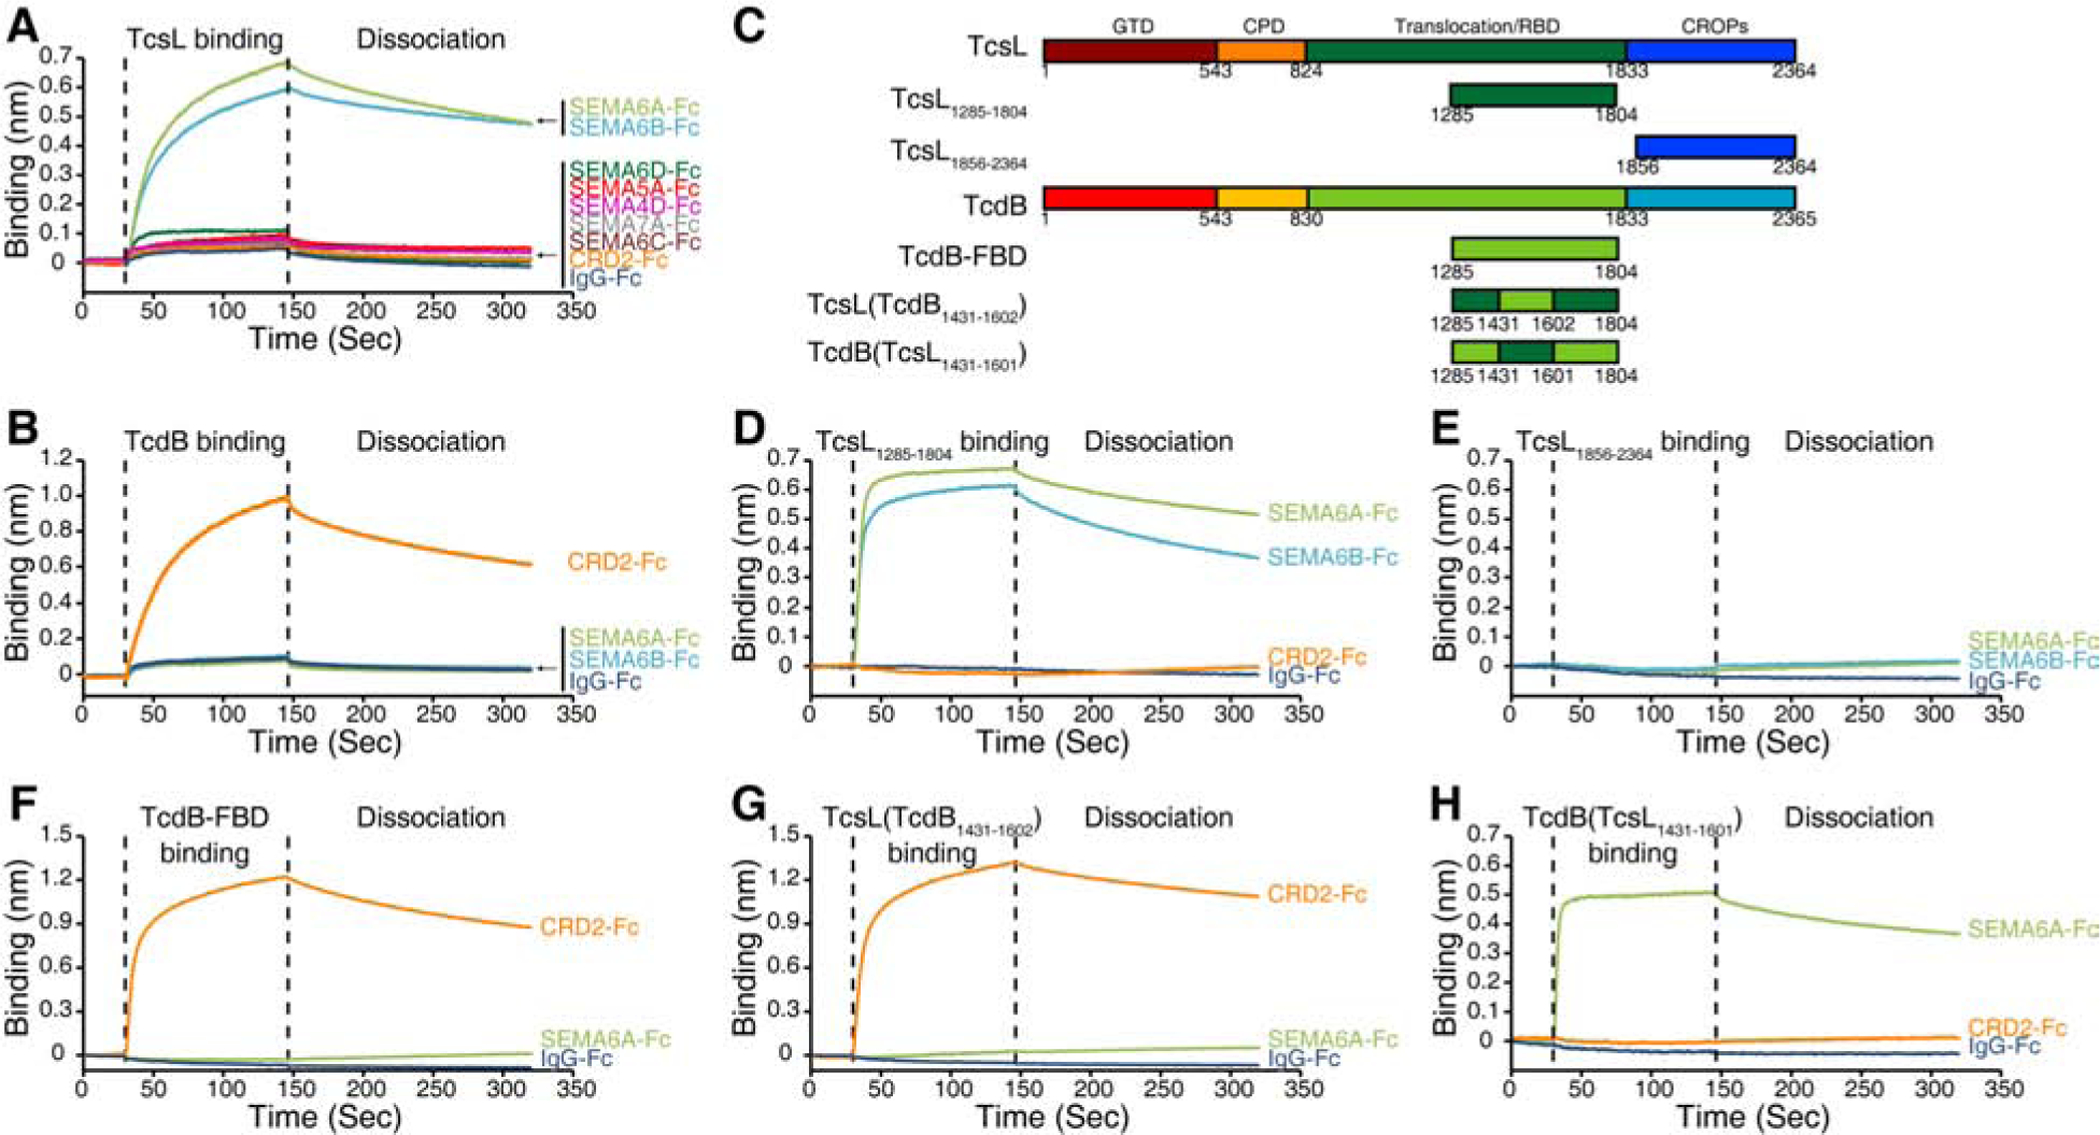
Figure 3. Characterization of TcsL-SEMA interactions.

(A) Binding of TcsL (1 μM) to Fc-tagged ECDs of SEMA6A, 6B, 6C, 6D, 4D, 5A, and 7A (immobilized onto capture biosensors) was examined using BLI assays. Fc-tagged CRD2-ECD and IgG-Fc were used as controls. Representative sensorgrams from one of three independent experiments are shown.
(B) Binding of full-length TcdB to CRD2, SEMA6A-ECD, 6B-ECD, and IgG-Fc was examined using BLI assays. Representative sensorgrams from one of three independent experiments are shown.
(C) Schematic diagrams of TcsL, TcsL1285–1804, TcsL1856–2364, TcdB, TcdB-FBD, TcsL(TcdB1431–1602), and TcdB(TcsL1431–1601). The numbers indicate the position of amino acid residues. GTD, glucosyltransferase domain; CPD, cysteine protease domain; RBD, receptor-binding domain; CROPs, combined repetitive oligopeptides.
(D-E) Binding of 1 μM TcsL1285–1804 (D) and TcsL1856–2364 (E) to Fc-tagged ECDs of SEMA6A and SEMA6B was examined using BLI assays. Fc-tagged CRD2-ECD and IgG-Fc were used as controls. Representative sensorgrams from one of three independent experiments are shown.
(F-H) Binding of 1 μM TcdB-FBD (F) and TcsL-TcdB chimeras (G: TcsL(TcdB1431–1602) and H: TcdB(TcsL1431–1601)) to Fc-tagged SEMA6A-ECD and CRD2 was examined using BLI assays. IgG-Fc was used as a control. Representative sensorgrams from one of three independent experiments are shown.
